Macro Iwwersiicht
Recap of critical events, week commencing Oct. 10
As CryptSslate attended Bitcoin Amsterdam, there was no weekly MacroSlate report for the week commencing Oct. 10. Key macro topics that occurred were;
On Oct. 13, the U.S. CPI inflation report showed a worrying jump in prices excluding food and energy for September, pushing the ten-year treasury to a high of 4.08%.
While Oct. 14 saw the U.K experience U-turn after U-turn on fiscal policy. BOE jumbo-sized gilt purchases were finalized, which stabilized yields. This leaves Japan as the only G7 central bank still supporting its government debt, while the ten-year treasury was above 25 bps and the yen against the dollar kept making fresh highs.
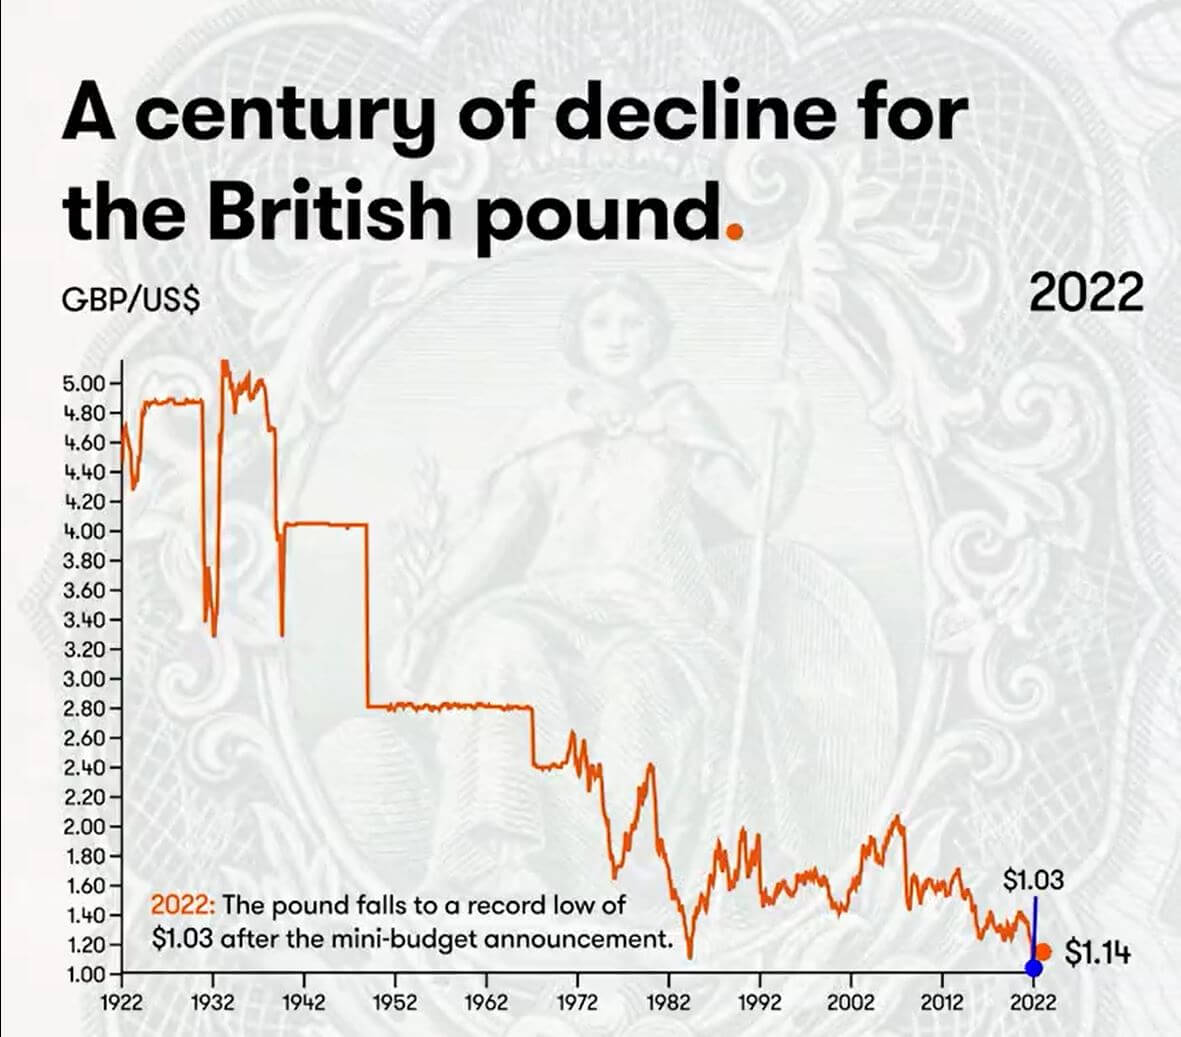
A century of decline for the British pound
The year 2022 has seen new lows for the British pound, with a government in disarray, the gilt market unstable, and the BOE acting as a backstop. The impact of poor monetary and fiscal policy decisions as its long-term bond yields convulsed and threatened the solvency of over-leveraged pension funds.
However, many investors believe this is a cycle, and the pound will return. If it’s cheap to buy, investors will buy it. However, this may not be the case; the U.K. is facing acute energy shortages and minimal fx reserves to defend the currency.
The last century has seen a massive decline in the British pound, and it doesn’t look like it will get better soon.
Since the U.S dollar came into existence in 1791, the free market rate was $4.55 to £1. Fast forward to 1925, and the pound has been sliding down against the dollar.
- 1925 – Winston Churchill returns sterling to the gold standard at the pre-war rate of $4.86.
- 1931 – The sterling comes off the gold standard, and the pound drops considerably. £1 is equivalent to $3.28.
- 1940 – Sterling drops with the outbreak of WWII. The British government pegs the value at £1 to $4.03.
- 1949 – The British government devalues the pound to $2.80 to support exports and rebalance the economy.
- 1967 – An economic crisis strikes. The British government devalues the pound to $2.40
- 1976 – High unemployment and inflation forced Britain to request an IMF loan. Sterling is allowed to float.
- 1985 – Ronald Regan’s tax cuts boosted the U.S economy and led to immense dollar strength.
- 1992 – the U.K exits the Exchange Rate Mechanism, and the pound drops to $1.48.
- 2001 – The pound falls to $1.40 after the dot-com bubble.
- 2008 – Global financial crash sees the dollar act as a haven currency.
- 2016 – Brexit referendum sees the pound fall to $1.23.
- 2022 – The pound falls to a record low of $1.03 after the mini-budget announcement.
(If you are curious, from 1861 – 1864, the £ surge to $~9 was US money fleeing the Civil War.)
Korrelatiounen
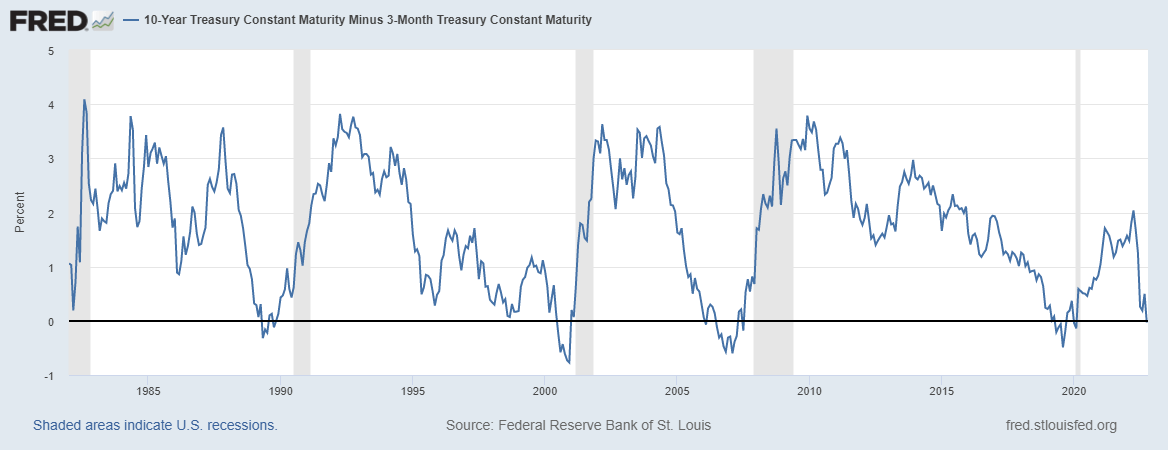
10 Year minus three-month treasury inverts has preceded every recession since WWII
When the 10-year and 2-year treasury note spread inverts, it is generally considered a warning of severe economic weakness; In contrast, when the credit spreads widen during times of financial stress, the flight to safe-haven assets such as the DXY, or the immediate need for dollar redemptions to meet payments.
The 10- year-three month spread inverted on Oct. 18, currently at -0.03bps, as many economists believe this is the accurate recession signal. The inversion of each yield curve has presaged every recession going back more than 40 years, and a recession usually occurs within the next six-twelve months.
Aktien & Volatilitéit Gauge
De Standard and Poor's 500, oder einfach de S&P 500, ass e Börseindex, deen d'Aktieleistung vu 500 grousse Firmen op den Austausch an den USA verfollegt. S&P 500 3,753 2.14% (5 D)
Den Nasdaq Stock Market ass eng amerikanesch Bourse baséiert zu New York City. Et ass op der zweeter Plaz op der Lëscht vun de Boursen no der Maartkapitaliséierung vun den gehandelte Aktien, hannert der New York Stock Exchange. NASDAQ 11,310 2.48% (5 D)
De Cboe Volatility Index, oder VIX, ass en Echtzäitmaartindex deen d'Erwaardunge vum Maart fir d'Volatilitéit an den nächsten 30 Deeg representéiert. Investisseuren benotzen de VIX fir den Niveau vum Risiko, Angscht oder Stress um Maart ze moossen wann Dir Investitiounsentscheedungen maacht. VIX 30 -8.33% (5 D)
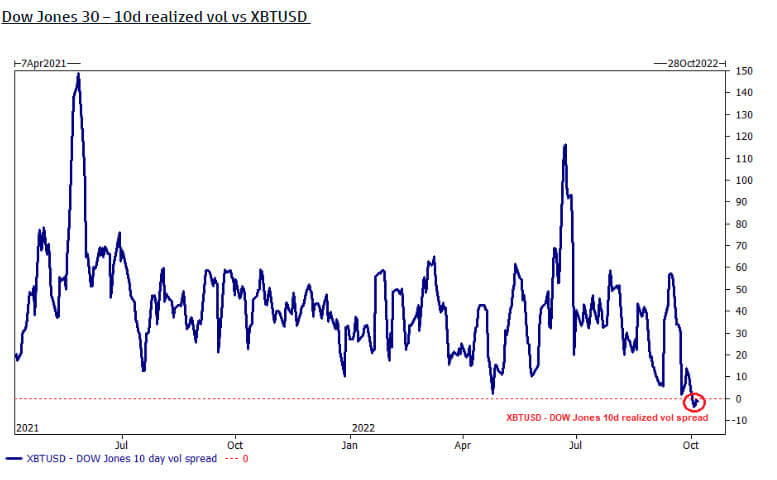
Bitcoin is less volatile than the Dow Jones
The Dow Jones (30 largest industrial stocks) is officially more volatile than Bitcoin, according to the ten-day realized vol spread. However, this is because Bitcoin over Q3 has stayed relatively flat in terms of USD price.
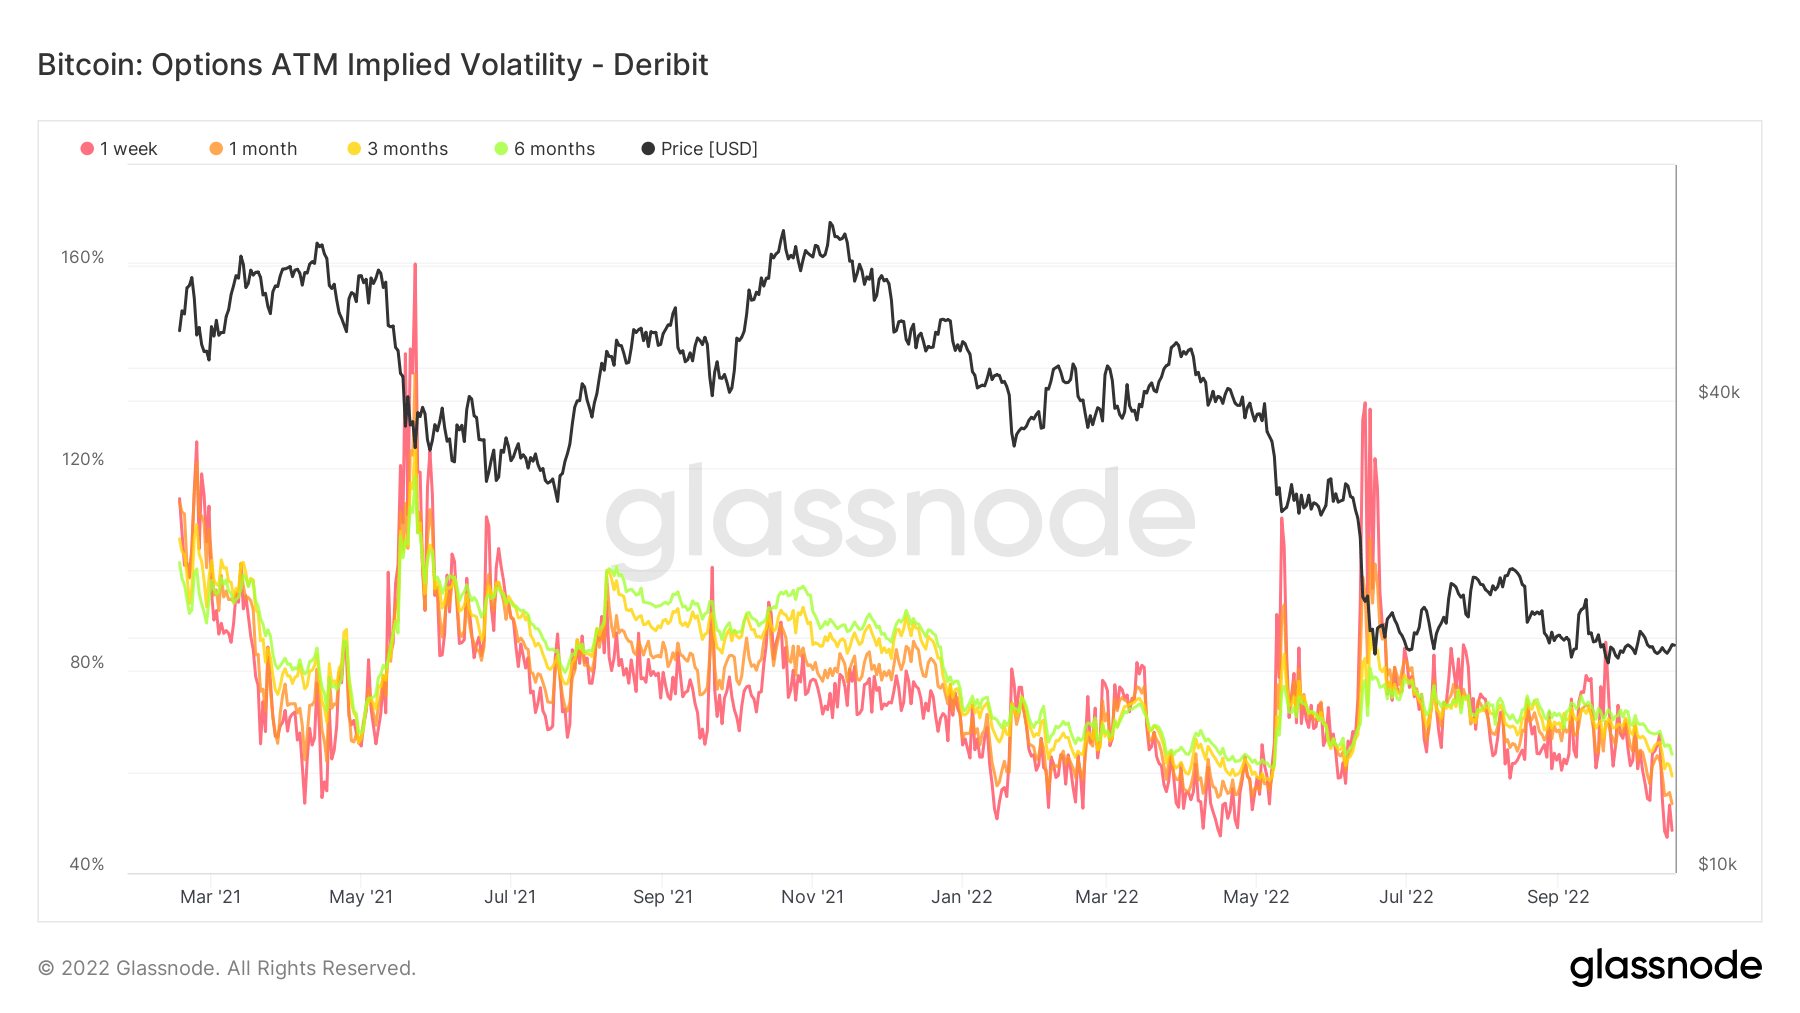
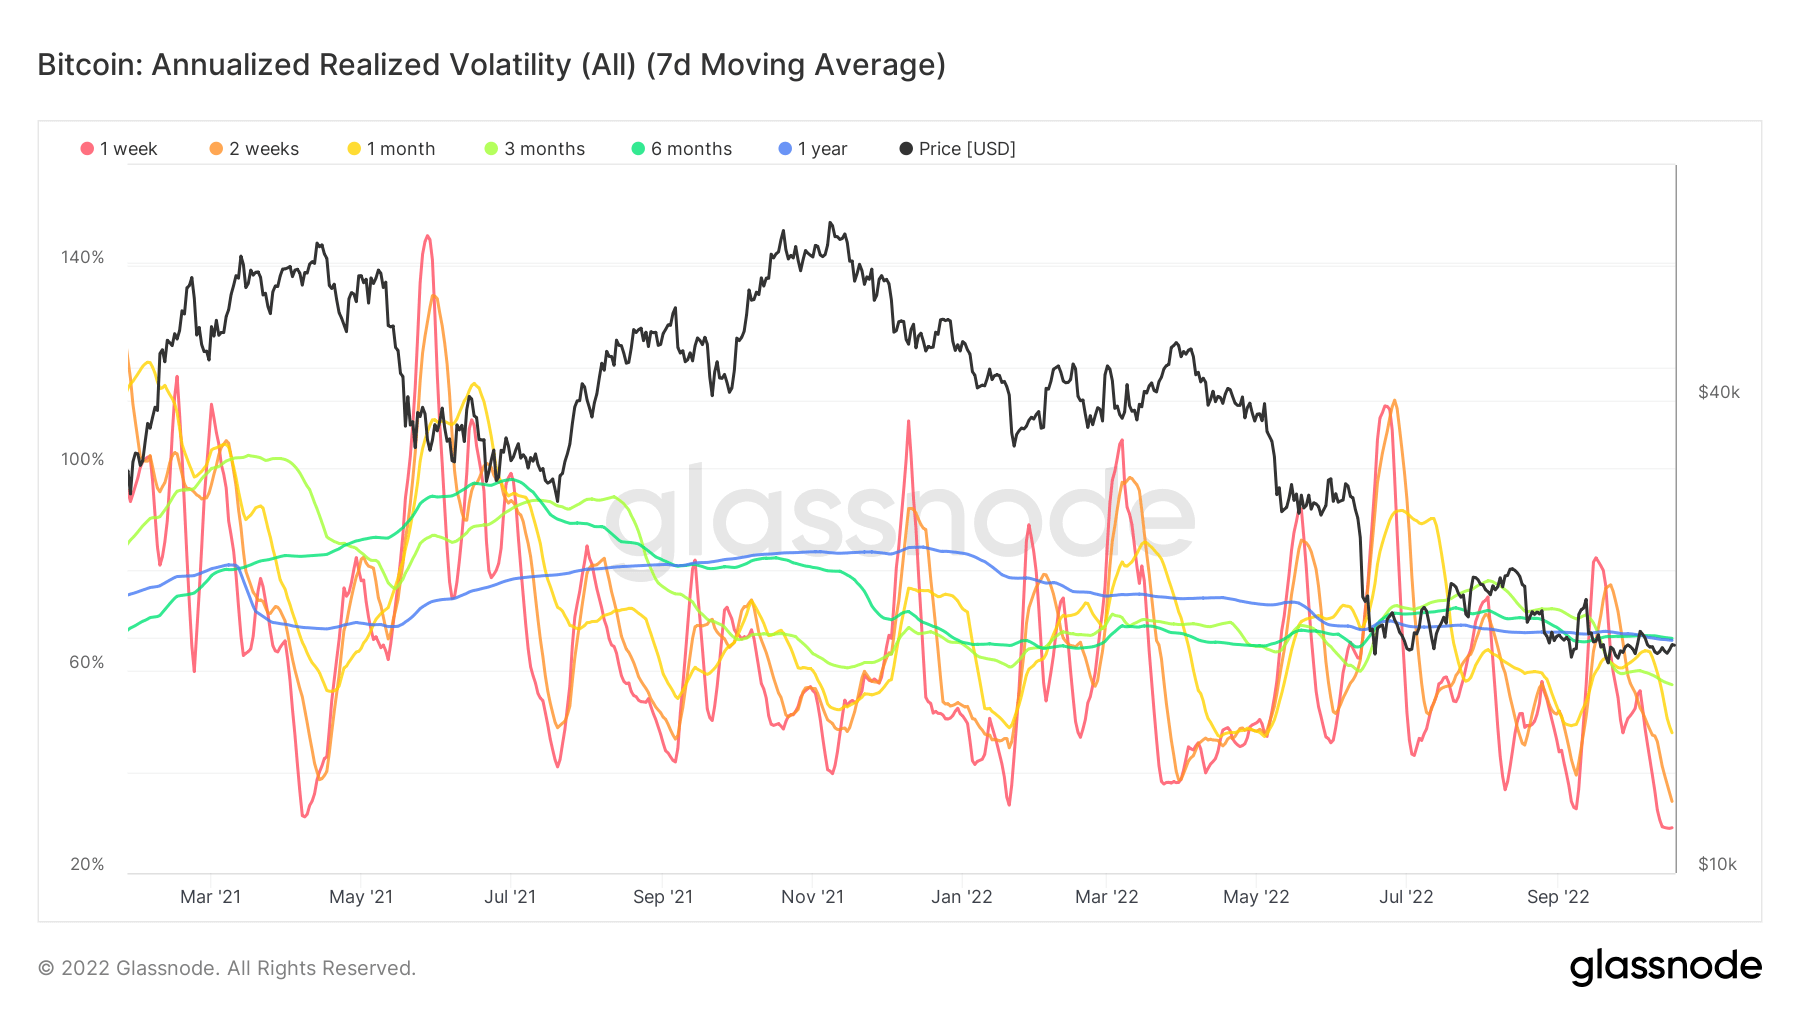
Bitcoin volatility at year-to-date lows
On-chain analytics shows the annualized realized volatility at an all-time low, just under 50% this week. Since March 2021, options implied volatility has been under 50% four times and has seen violent swings in price shortly after.
iwwerdeems implizit Volatilitéit refers to the market’s assessment of future volatility, realized volatility measures what happened in the past. Insinuating that volatility has been at extremely low levels is encouraging, while traditional financial assets and currencies are as volatile as they come.

COMMODITIES
D'Demande fir Gold gëtt festgeluegt duerch d'Quantitéit u Gold an den Zentralbankreserven, de Wäert vum US-Dollar, an de Wonsch Gold als Hedge géint Inflatioun a Währungsdevaluatioun ze halen, all hëllefen de Präis vum Edelmetall ze féieren. Goldpräis $1,658 0.61% (5 D)
Ähnlech wéi déi meescht Commodities, gëtt de Sëlwerpräis duerch Spekulatioun an Offer an Nofro bestëmmt. Et ass och beaflosst vu Maartbedéngungen (grouss Händler oder Investisseuren a Kuerzverkaaf), industriell, kommerziell a Konsumentefuerderung, Hedge géint finanzielle Stress, a Goldpräisser. Sëlwer Präis $19 5.52% (5 D)
U.S. homebuilders’ sentiment hits a new low
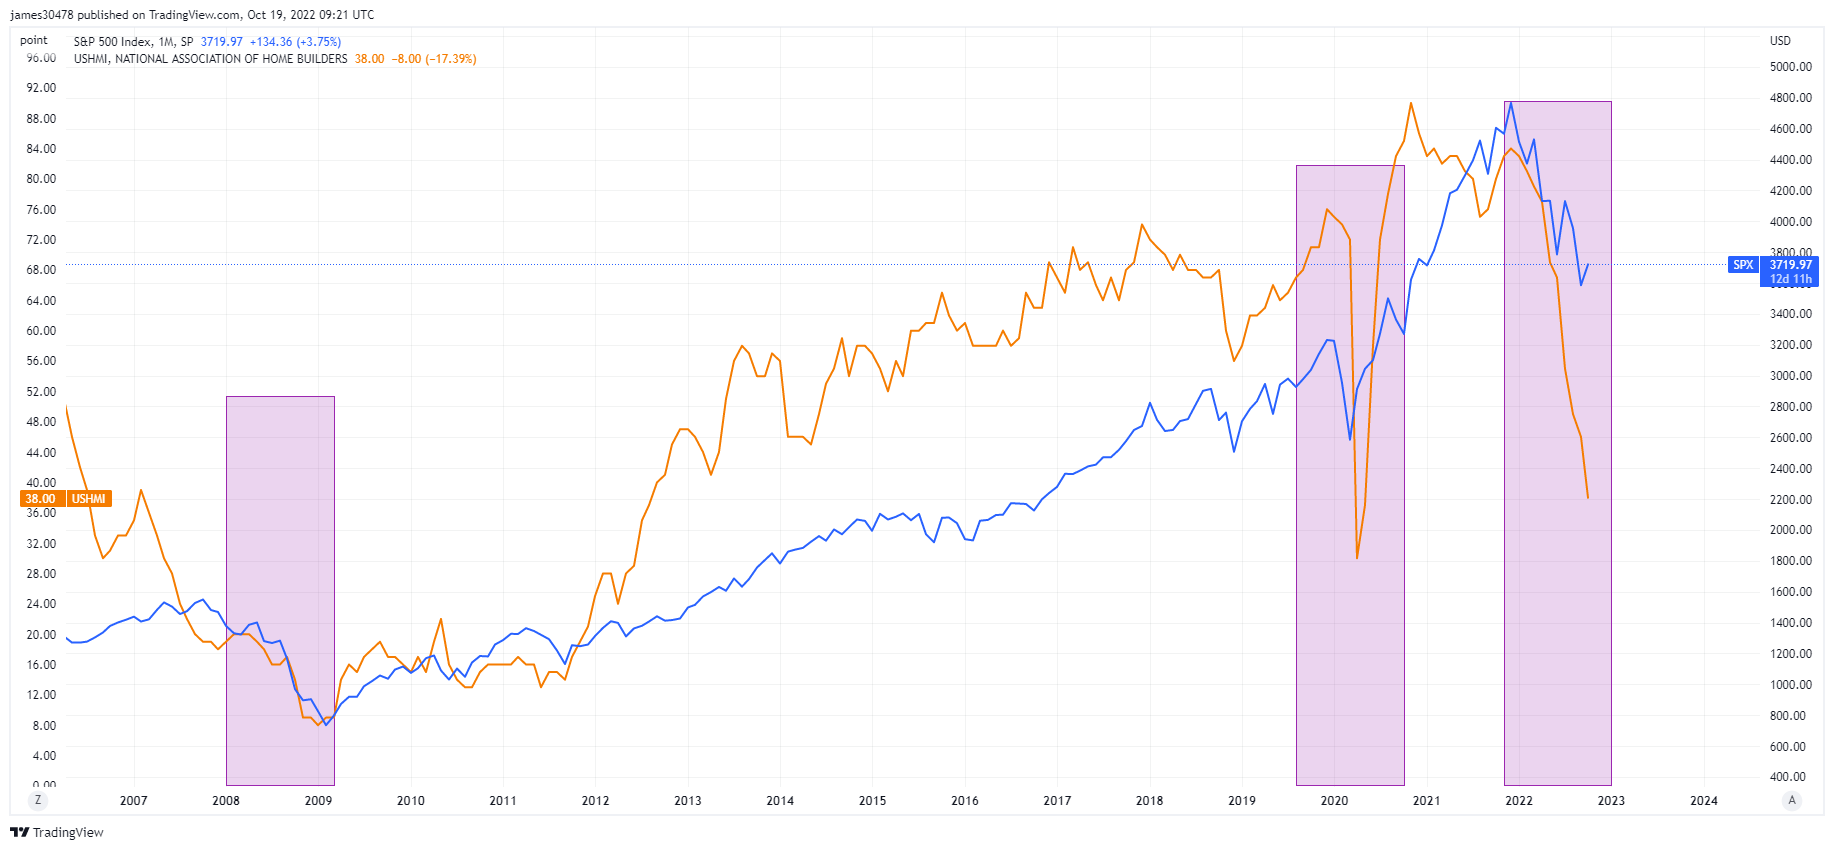
The National Association of House Builders, housing market index sank another 8 points to 38 in October, going back to lows last seen in 2012, just after the GFC recovery. Mortgage rates approaching 7% have significantly weakened demand.
Overlaying the NAHB and S&P 500, with the past two recessions in 2008 and 2020, doesn’t bode well for what’s coming at the end of this year and into 2023; equities could continue to plunge further to the downside if the trend continues to be your friend.
U.S. Construction building a bigger problem
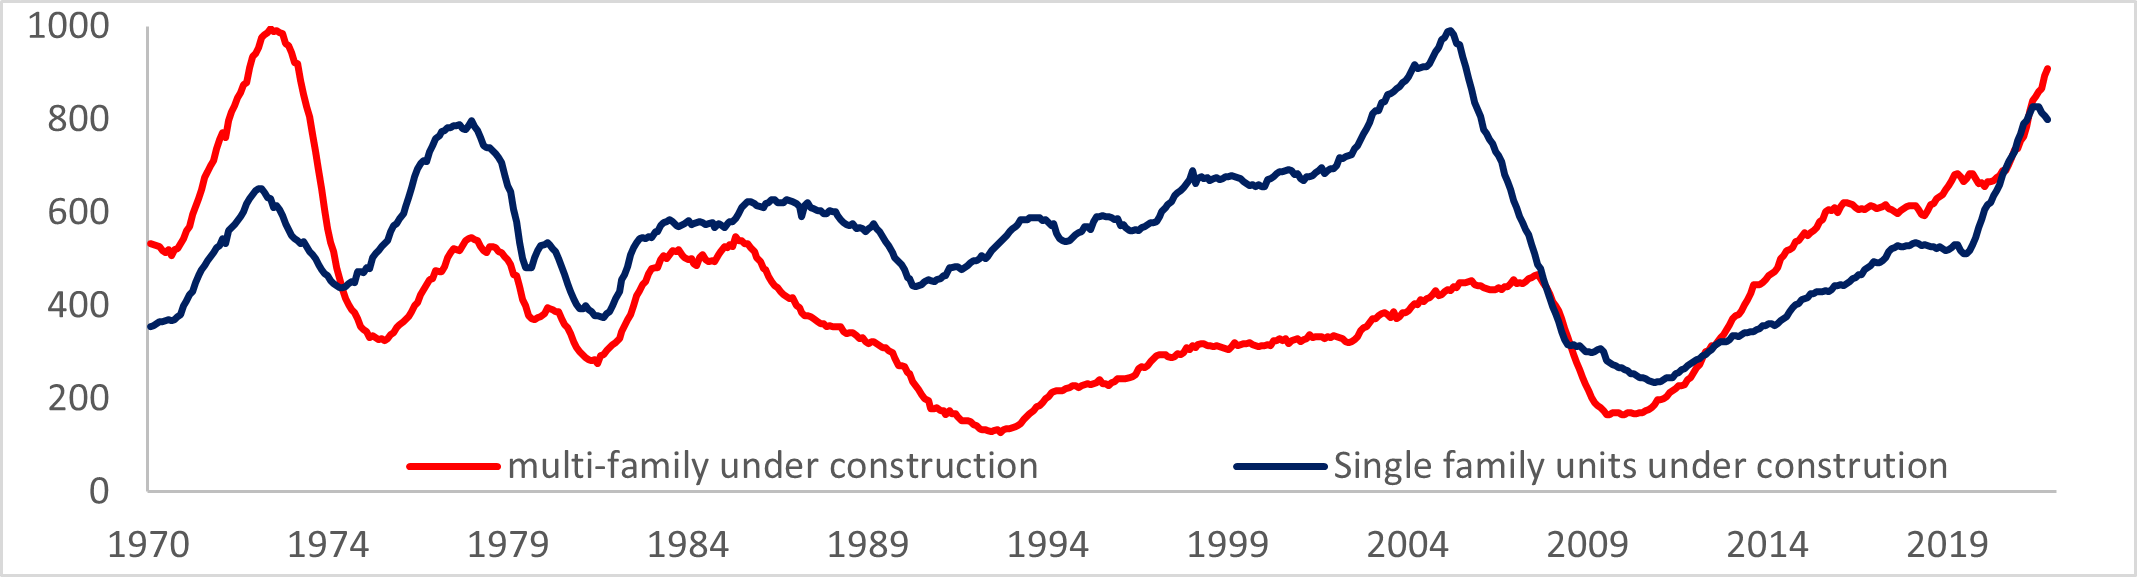
According to MBA, the average 30- year mortgage rate rose 6.92%, and mortgage applications for home purchases fell considerably, almost 4%.
Increase in permits following continued strong demand for rental units, while single-home family permits declined to the lowest since the pandemic. More units are currently under construction than at any time since 1974; this does not seem to bode well for multifamily construction.
Tariffer & Währung
Den 10-Joer Treasury Note ass eng Scholdverpflichtung ausgestallt vun der US Regierung mat enger Reife vun 10 Joer no der éischter Emissioun. Eng 10-Joer Treasury Note bezilt Zënsen mat engem fixen Taux eemol all sechs Méint a bezilt de Gesiichtswäert un den Inhaber bei der Reife. 10Y Treasury Yield 4.221% 4.95% (5 D)
Den US Dollar Index ass eng Moossnam vum Wäert vum US Dollar relativ zu engem Kuerf vun auslännesche Währungen. DXY 111.875 -1.12% (5 D)
Unparalleled moves in the fixed-income market
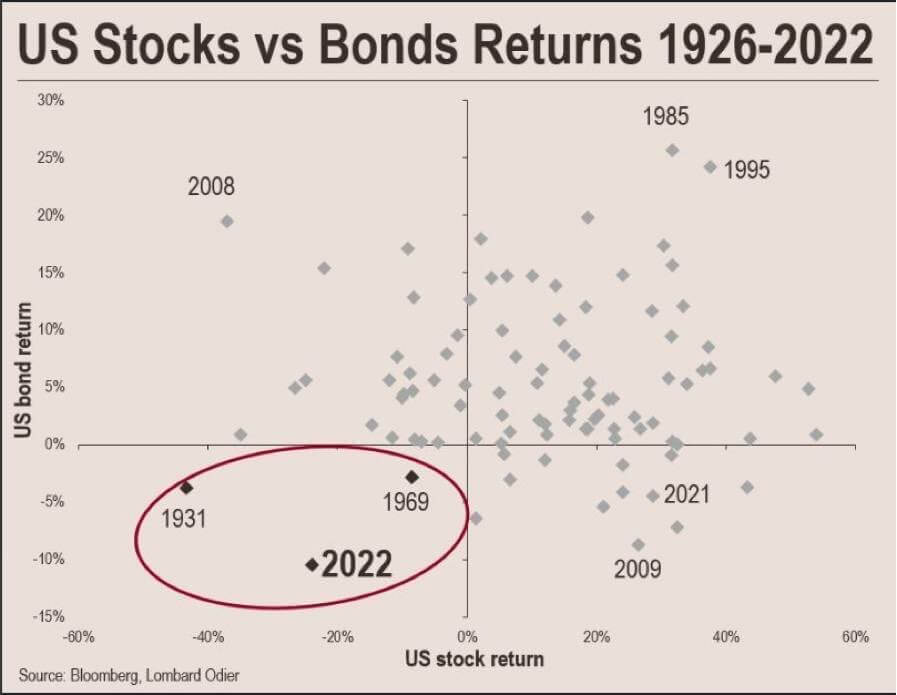
2022 has been an unprecedented year for asset performance; the 60/40 portfolio year to date is the worse performance in 100 years, according to BofA, even worse than the global depression of 1929.
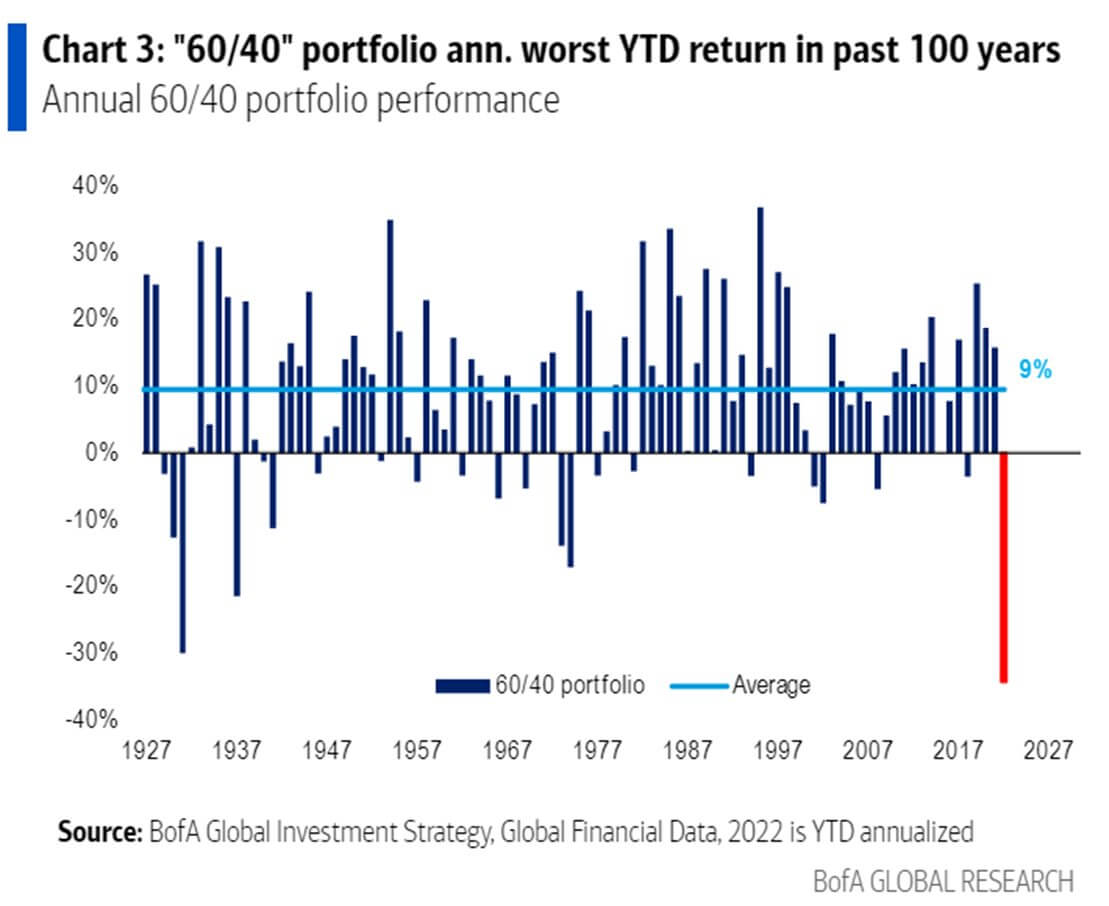
So far, in 2022, the U.S stock and bond market has lost a combined value of nearly $60 trillion. The last time the U.S. markets faced a drawdown of this severity, the U.S. government defaulted its gold peg within the next two years.
In 1933, executive order 6102 required all persons to deliver gold bullion to the Federal Reserve for $20.67 per troy ounce. The U.S had been on a gold standard since 1879, but the Great Depression in the 1930s frightened the public into hoarding gold.
Second, in 1971, during the Nixon shock, President Nixon closed the gold window 1971, the convertibility of U.S dollars into gold, to address the country’s inflation problem and to discourage foreign governments from redeeming more dollars for gold.
Bitcoin Iwwersiicht
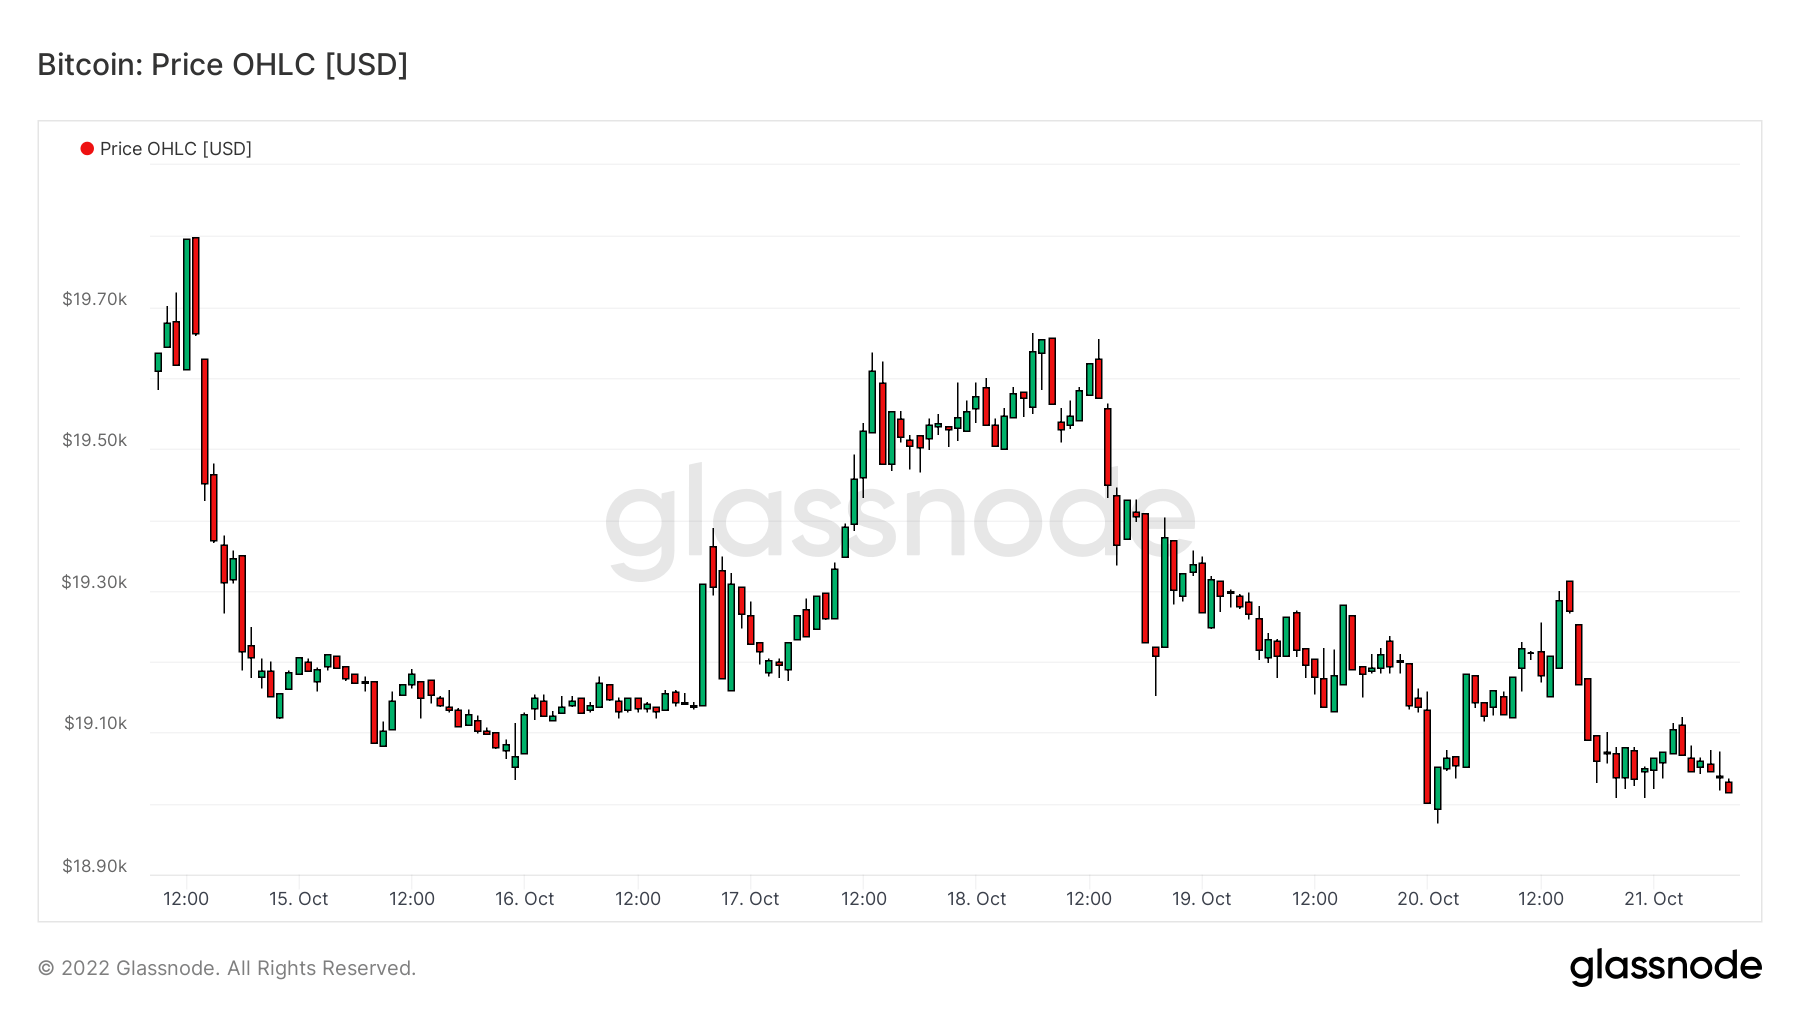
De Präis vun Bitcoin (BTC) an US Dollar. Bitcoin Präis $19,160 -1.93% (5 D)
D'Mooss vum Bitcoin säi Gesamtmaartkapital géint de gréissere Krypto-Währungsmarktkapital. Bitcoin Dominanz 41.93% 0.36% (5 D)
- Bitcoin hash rate continued to soar – 260 EH/S
- Futures open interest denominated in BTC hits 650k
- Difficulty projected to increase by 3%
- Asia trade premium at its highest since the last bear market in 2019-2020
Adressen
Sammlung vun Kär Adress Metriken fir de Reseau.
D'Zuel vun eenzegaartegen Adressen déi am Netz aktiv waren entweder als Sender oder Empfänger. Nëmmen Adressen déi aktiv waren an erfollegräichen Transaktioune ginn gezielt. Aktiv Adressen 889,323 3.64% (5 D)
D'Zuel vun eenzegaartegen Adressen déi fir d'éischte Kéier an enger Transaktioun vun der gebierteg Mënz am Netz erschéngen. Nei Adressen 406,205 1.97% (5 D)
D'Zuel vun eenzegaarteg Adressen Holding 1 BTC oder manner. Adressen mat ≥ 1 BTC 908,988 0.40% (5 D)
D'Zuel vun eenzegaarteg Adressen Holding op d'mannst 1k BTC. Adressen mat Gläichgewiicht ≤ 1k BTC 2,128 0.52% (5 D)
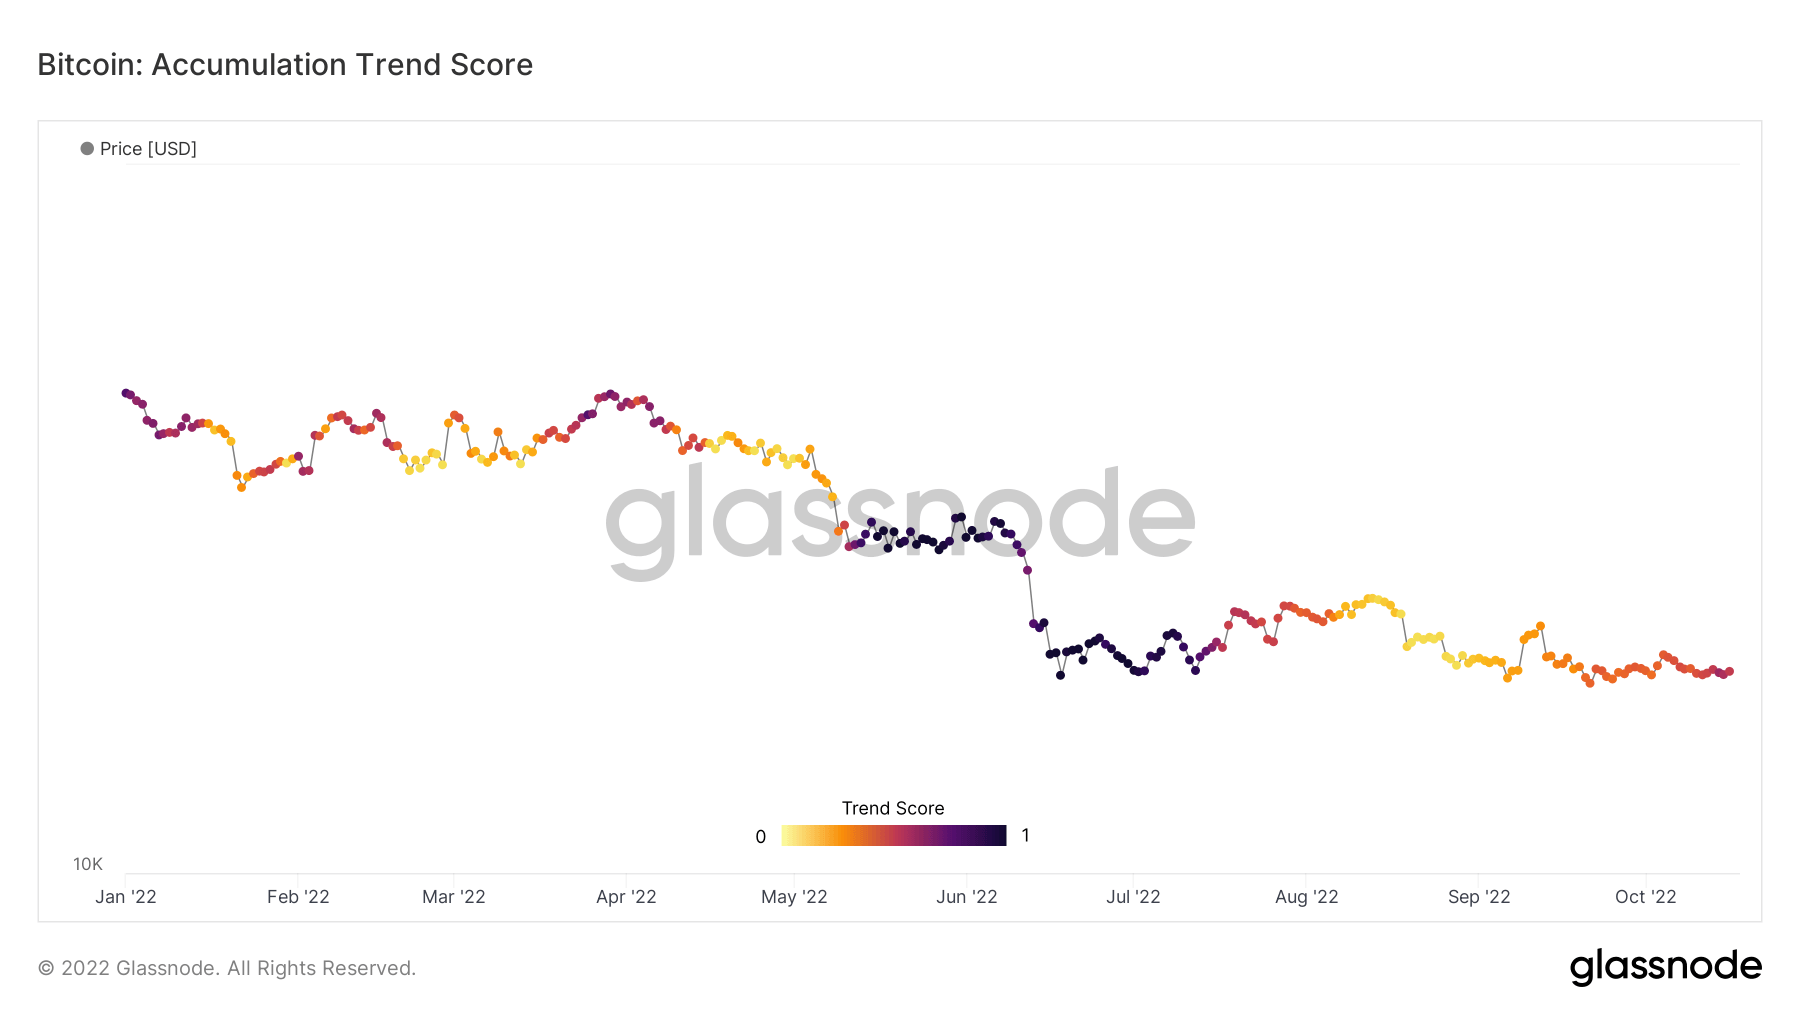
Net accumulation for the first time since July
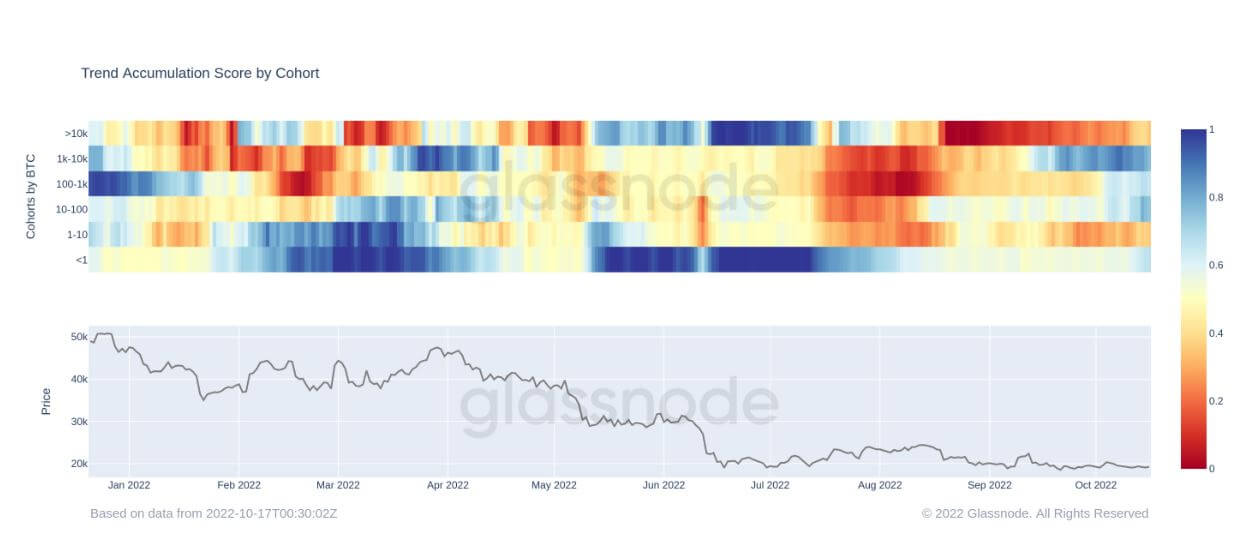
The Accumulation Trend Score is an indicator that reflects the relative size of entities that are actively accumulating coins on-chain in terms of their BTC holdings. The scale of the Accumulation Trend Score represents both the size of the entities balance (their participation score) and the amount of new coins they have acquired/sold over the last month (their balance change score).
An Accumulation Trend Score of closer to 1 indicates that, on aggregate, larger entities (or a big part of the network) are accumulating, and a value more relative to 0 means they are distributing or not accumulating. This provides insight into the balance size of market participants and their accumulation behavior over the last month.
Since the beginning of August, the Bitcoin ecosystem has seen net distributors due to fear around the macro uncertainty with traditional finance assets getting hammered. However, since then, BTC has stayed relatively flat, hovering around the $20k mark, which has been encouraging to see and has most likely alerted wall street that this asset is here to stay.
By looking at the cohorts below, a number of them are accumulating again, such as whales between 1k-10k BTC and retail with less than 1 BTC. Whales that hold 10k BTC or more are still net sellers but have turned into more of an orange than a red, which shows their distribution is being reduced and less selling pressure has occurred.
Dervativ
En Derivat ass e Kontrakt tëscht zwou Parteien, dee säi Wäert / Präis vun engem ënnerierdesche Verméigen ofleet. Déi heefegst Aarte vun Derivate sinn Futures, Optiounen a Swaps. Et ass e finanziellt Instrument dat säi Wäert / Präis aus dem ënnerierdesche Verméigen ofgeleet.
De Gesamtbetrag vun de Fongen (USD Value) zougewisen an oppe Futures Kontrakter. Futures Open Interessi $ 12.68B 5.20% (5 D)
De Gesamtvolumen (USD Value) gehandelt an Futures Kontrakter an de leschten 24 Stonnen. Futures Volumen $ 24.35B $153.29 (5 D)
D'Zomm liquidéiert Volumen (USD Value) vu Kuerzpositiounen an Futures Kontrakter. Total Long Liquidatiounen $ 42.01M $0 (5 D)
D'Zomm liquidéiert Volumen (USD Wäert) vu laange Positiounen an Futures Kontrakter. Total Short Liquidatiounen $ 42.01M $ 3.25M (5 D)
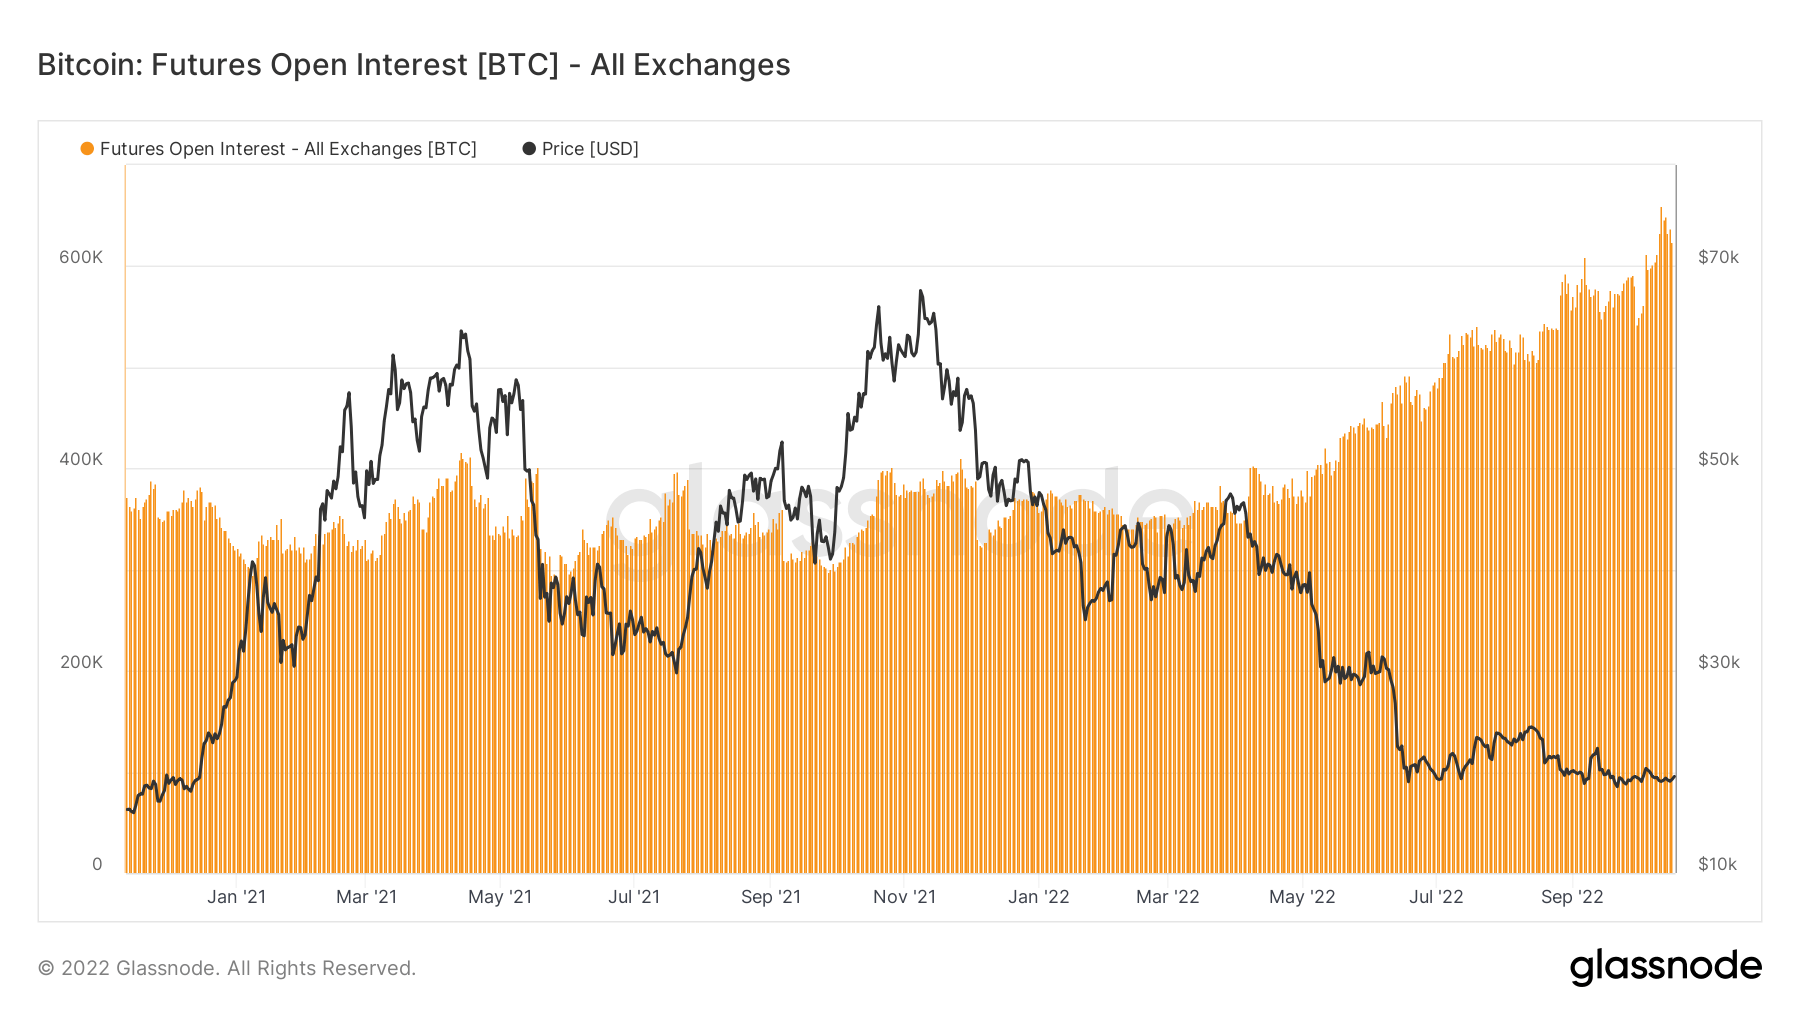
Futures open interest at all-time highs denominated in Bitcoin
Futures’ open interest, the total amount of (USD value) allocated in available futures contracts, has hit an all-time high. This tells us that levels of speculation within the market are increasing, despite Bitcoin falling over 70% from its all-time high.
Futures open interest has stayed relatively flat from January 2021 to May 2022, roughly 350k BTC but has soared to 640k denominated in Bitcoin futures open interest.
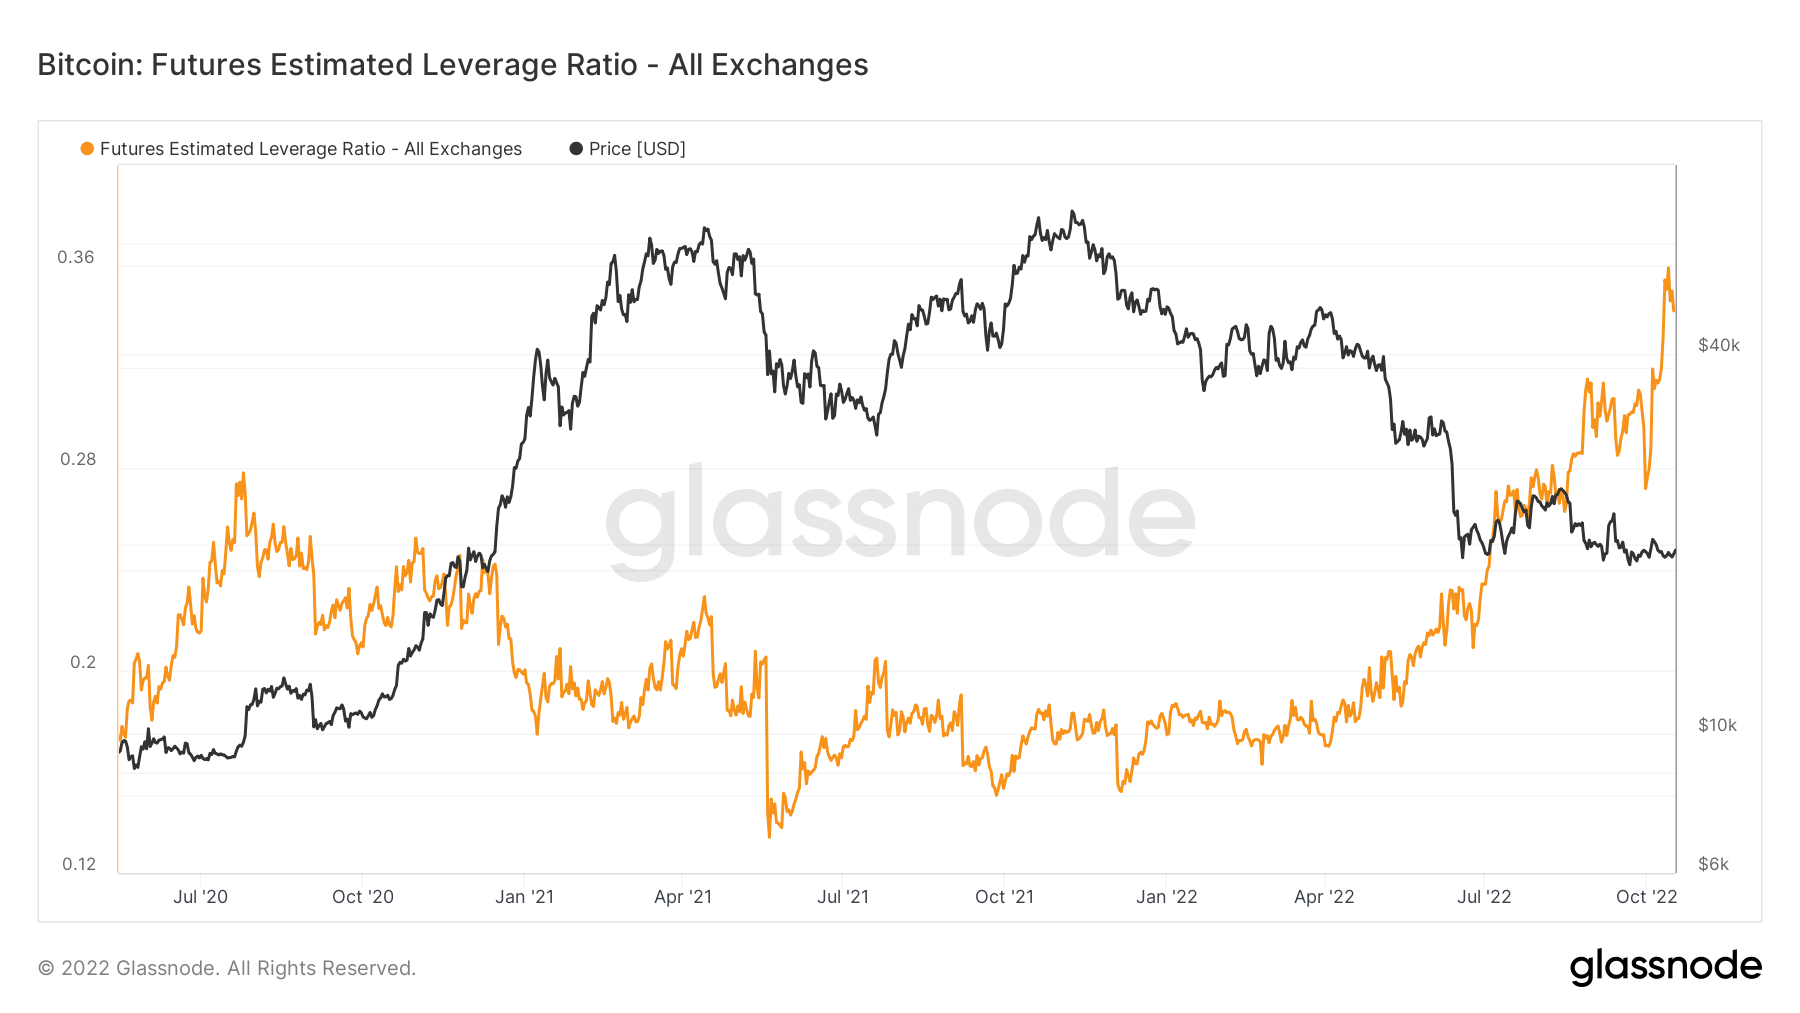
Leverage continues to increase
The Estimated Leverage Ratio is defined as the ratio of the open interest in futures contracts and the balance of the corresponding exchange.
From May 2020 to May 2022, the ELR has stayed in a constant range of around 0.17 to 0.25; however, since June 2022, the ELR has seen a remarkable climb. The ELR is at an all-time high, and a significant amount of leverage needs to be unwound. The BTC ecosystem has low liquidity right now due to being in a bear market while a substantial amount of cash remains on the sidelines; expect to see this leverage start to come down.
Miner
Iwwersiicht vun wesentleche Miner Metriken am Zesummenhang mat Hashing Kraaft, Einnahmen, a Blockproduktioun.
Déi duerchschnëttlech geschätzte Zuel vun Hashes pro Sekonn produzéiert vun de Miner am Netz. Hash Taux 262 TH / s 2.34% (5 D)
Déi aktuell geschätzte Zuel vun den Hashen déi néideg sinn fir e Block ze minen. Bemierkung: Bitcoin Schwieregkeet gëtt dacks als déi relativ Schwieregkeet mat Respekt zum Genesisblock bezeechent, wat ongeféier 2^32 Hashes erfuerdert. Fir e bessere Verglach iwwer Blockchainen, sinn eis Wäerter a roude Hashes bezeechent. Schwieregkeet 152 T 13.43% (14 D)
D'total Versuergung ofgehalen an Miner Adressen. Miner Gläichgewiicht 1,830,490 BTC -0.20% (5 D)
De Gesamtbetrag vun de Mënzen, déi vu Miner transferéiert goufen fir Portemonnaien auszetauschen. Nëmmen direkt Transfere ginn gezielt. Miner Net Positioun änneren -23,592 BTC -14,681 BTC (5 D)
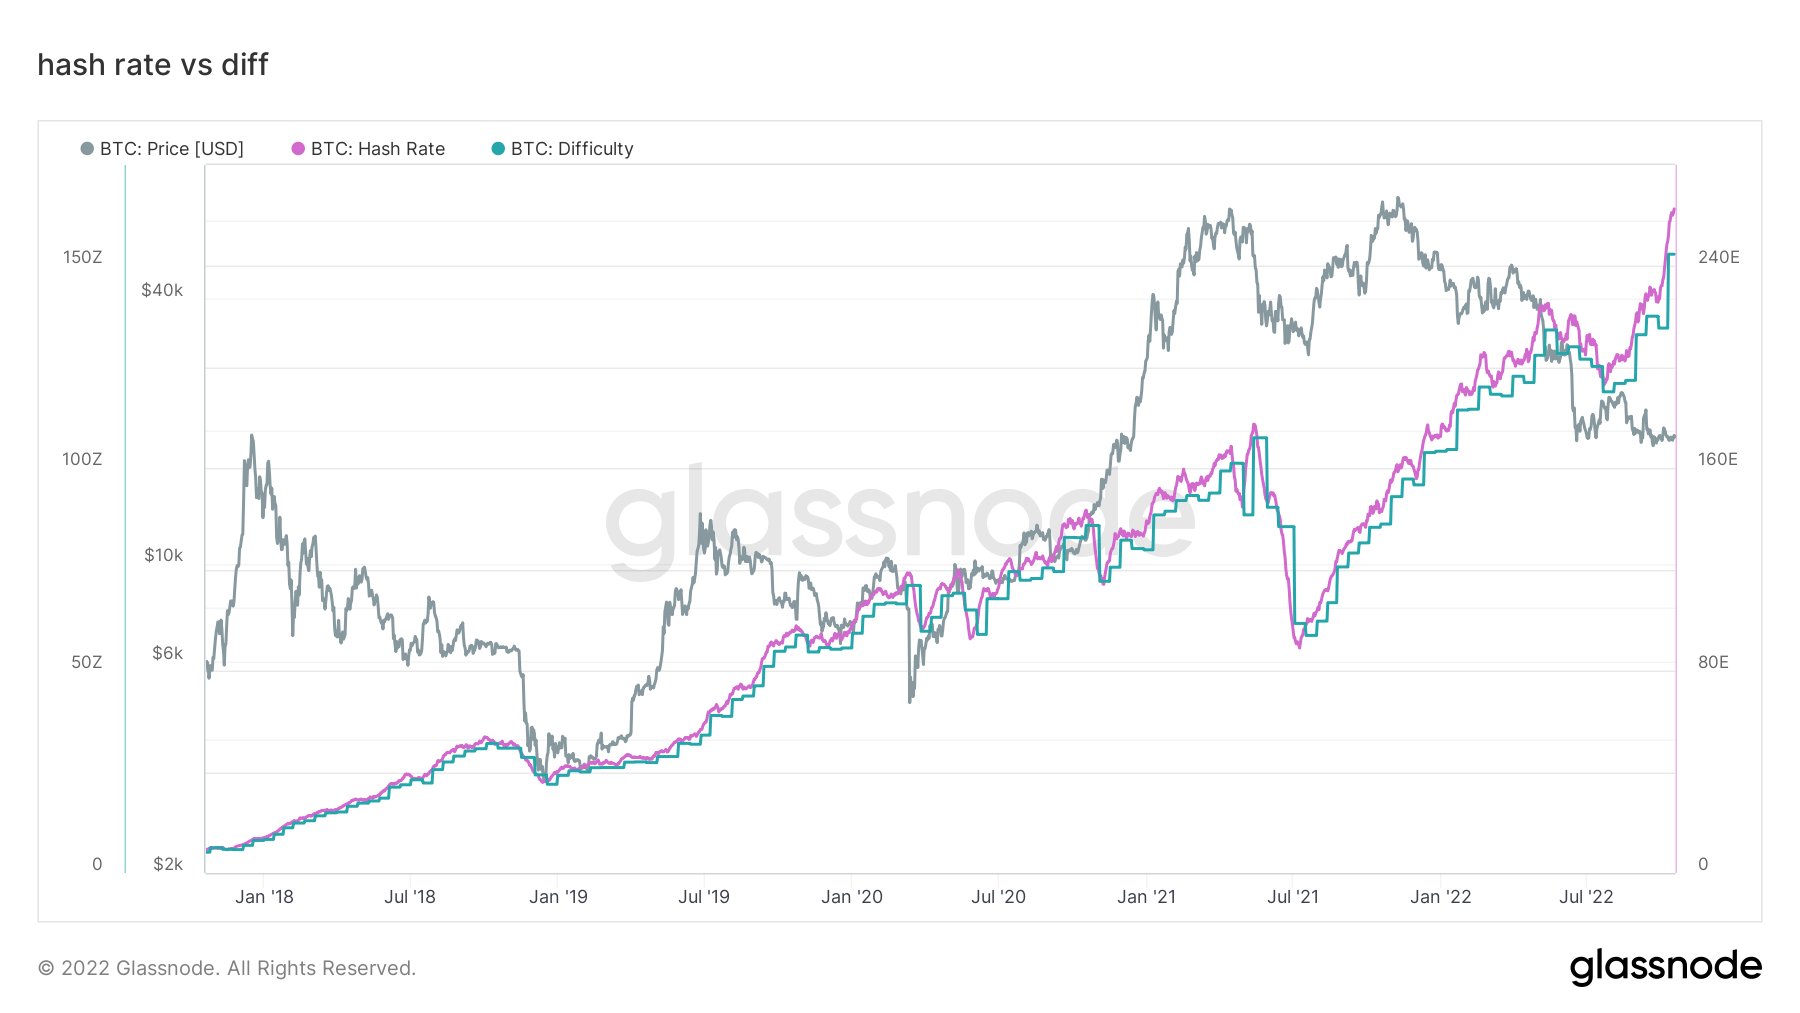
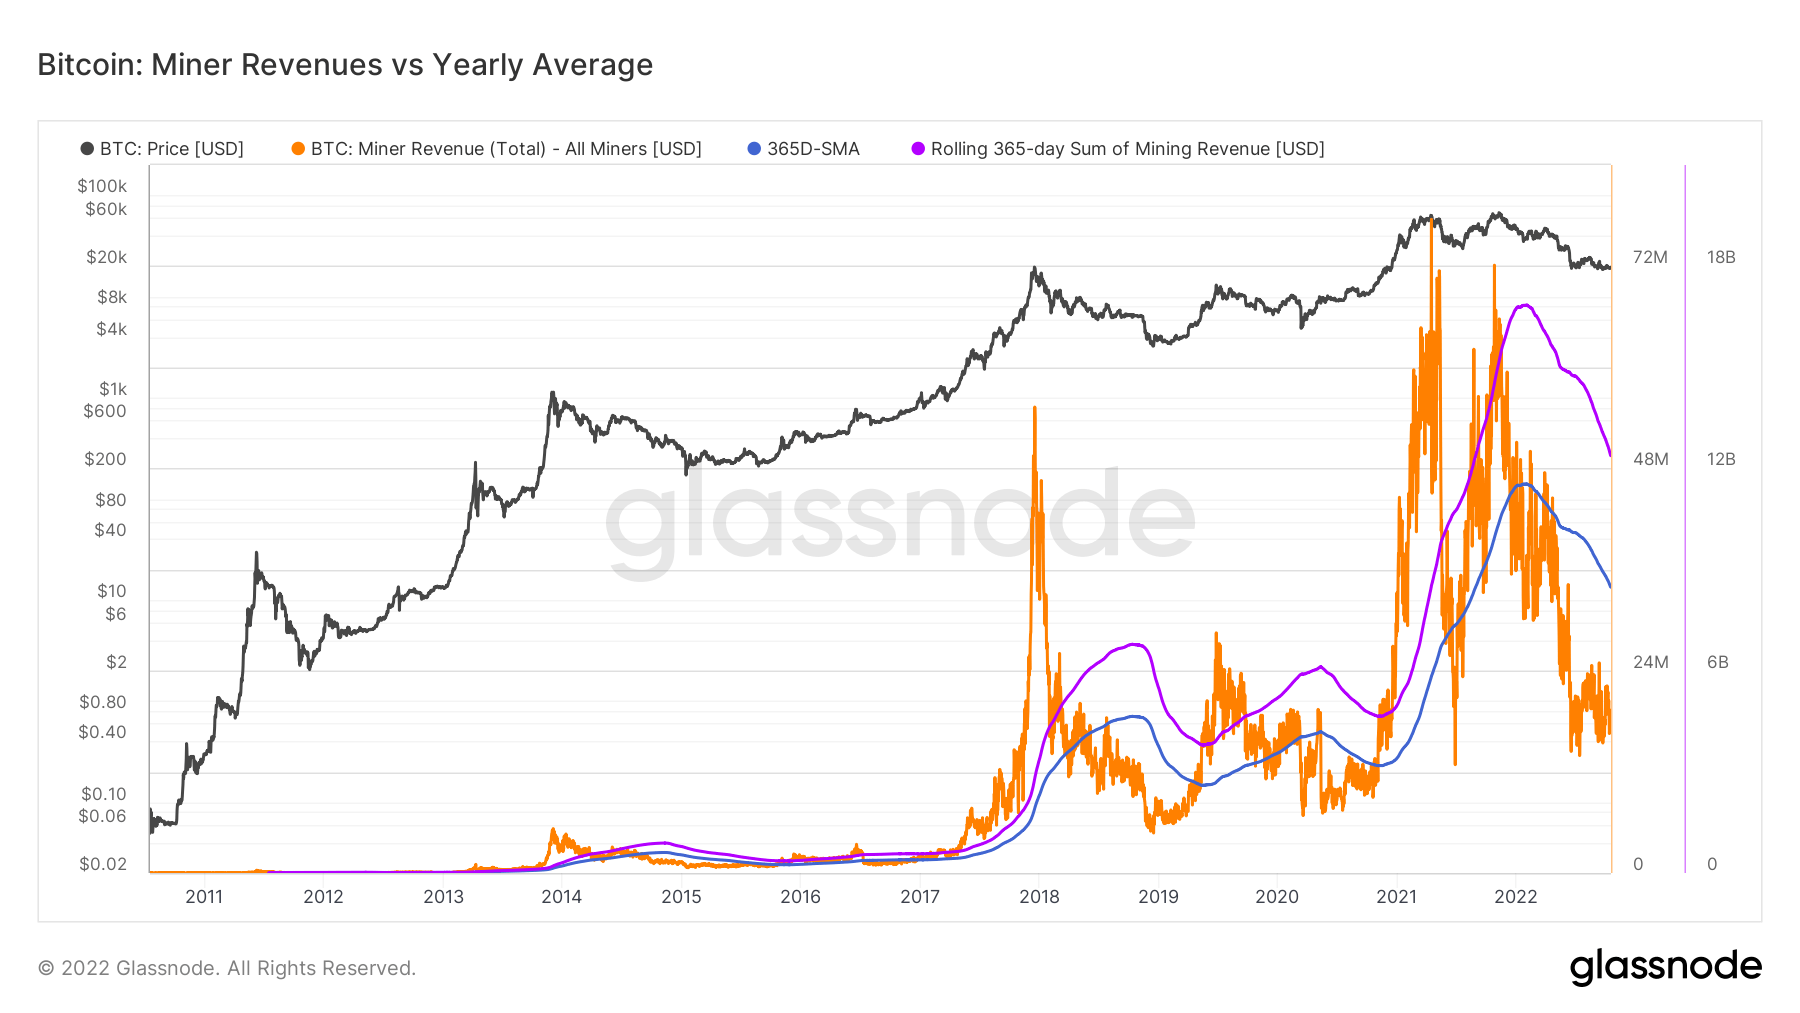
Miners continue to get squeezed
Throughout August to October, the hash rate has gone exponential, from 220 EH/S up to 260 EH/s, this is unheard of during a bear market, and difficulty is playing catch up, which is also at an all-time high, continuing to squeeze miner revenue. When the next difficulty epoch is completed, it is projected to adjust another 3% to the upside. A distant memory of May 2021, when China banned mining and saw the network drop to 84 EH/S.
To contextualize the stress miners are under and the lack of revenue they are incurring is the metric below miner revenue vs. the yearly average. Demonstrates the daily USD revenue paid to BTC miners in orange and compare it to the 365-day moving average. While also observing the aggregate industry income on a rolling 365-day sum of miner revenues.
On-Chain Aktivitéit
Sammlung vun On-Chain Metriken am Zesummenhang mat zentraliséierter Austauschaktivitéit.
De Gesamtbetrag vun de Mënzen déi op Austauschadressen ofgehale ginn. Exchange Gläichgewiicht 2,343,473 BTC -57,299 BTC (5 D)
Déi 30 Deeg Ännerung vun der Versuergung ofgehalen an Austausch Portemonnaien. Exchange Net Position Change 281,432 BTC -395,437 BTC (30 D)
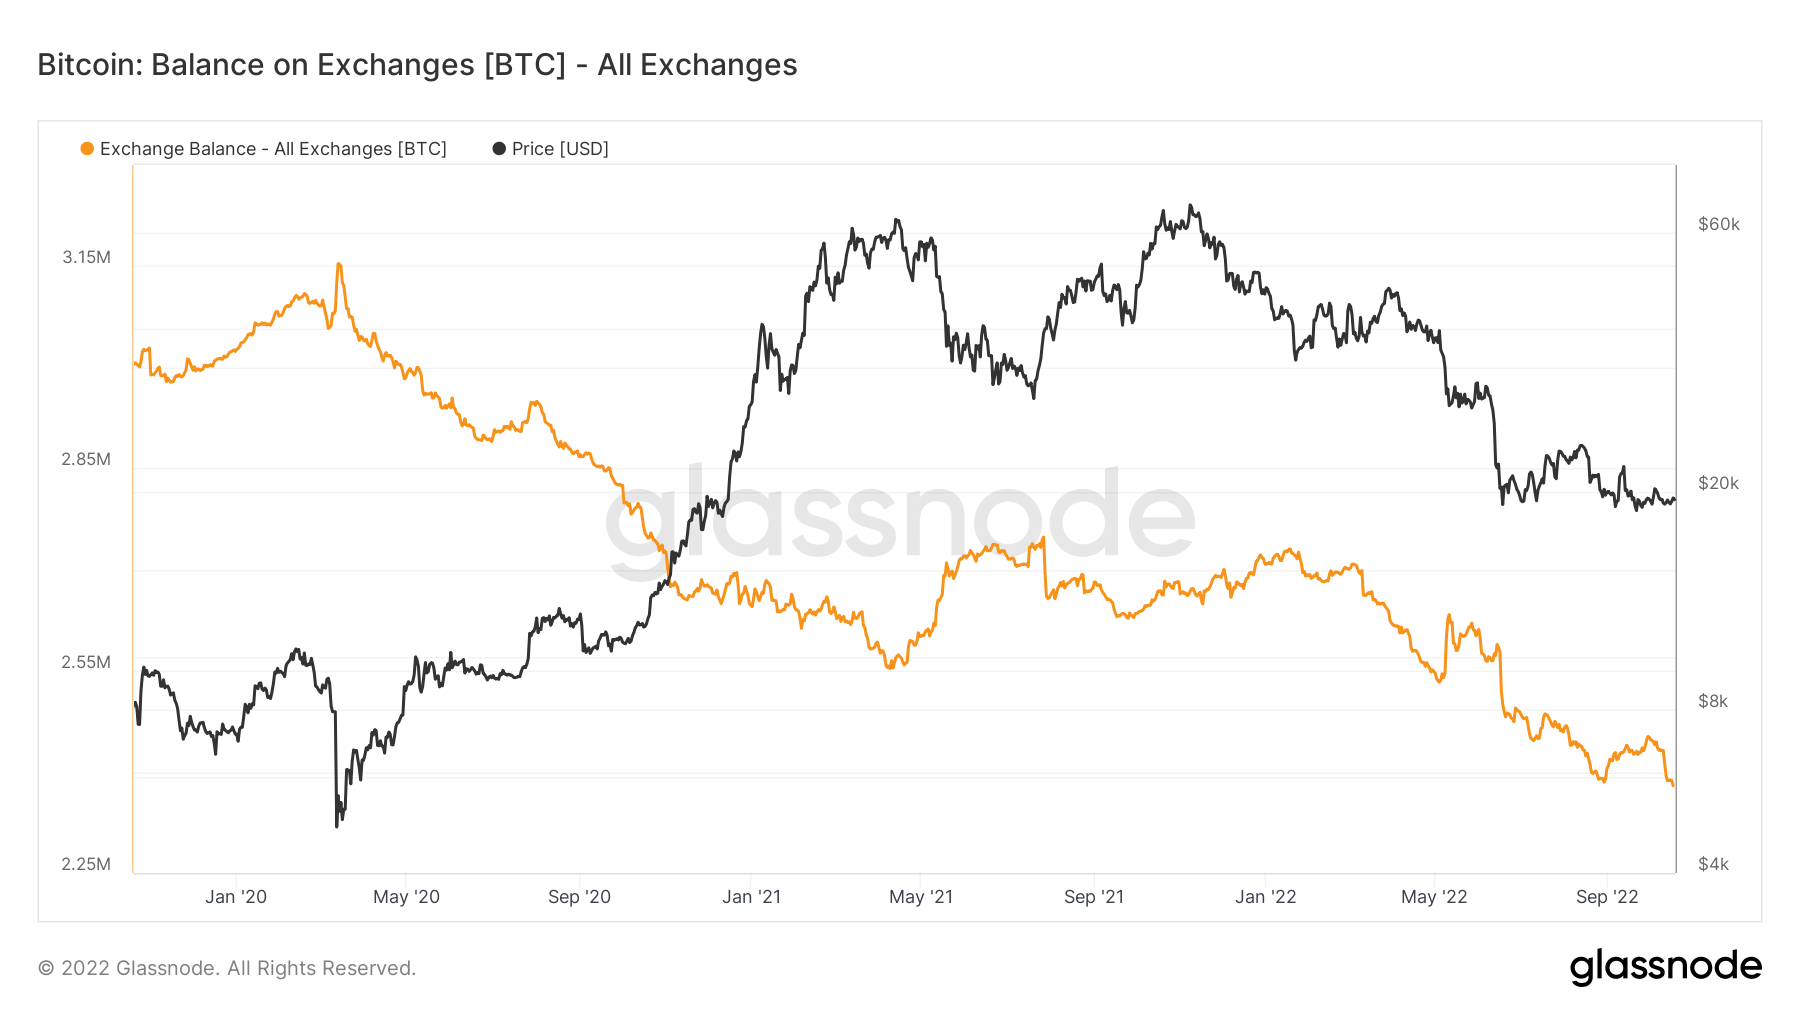
Bitcoin held on exchanges reached its lowest in 4 years
Bitcoin ofgehale vun Austausch huet säin niddregsten a véier Joer erreecht. De Moment ass de Bitcoin Betrag, deen duerch Austausch gehale gëtt, just ënner $ 2,4 Milliounen, wat duerch d'orange Linn an der Grafik hei ënnen duergestallt gëtt.
Over 300,000 Bitcoins have been removed from the exchanges during winter, indicating a bullish trend among investors. This lowered the supply held by exchanges to its 4-year lowest. The last time the Bitcoin balance on exchanges was around $2,4 million was in late 2018.
Déi aktuell $ 2,4 Milliounen, déi an den Austausch gehale ginn, entspriechen ongeféier 12% vun der ganzer Bitcoin Versuergung um Maart.
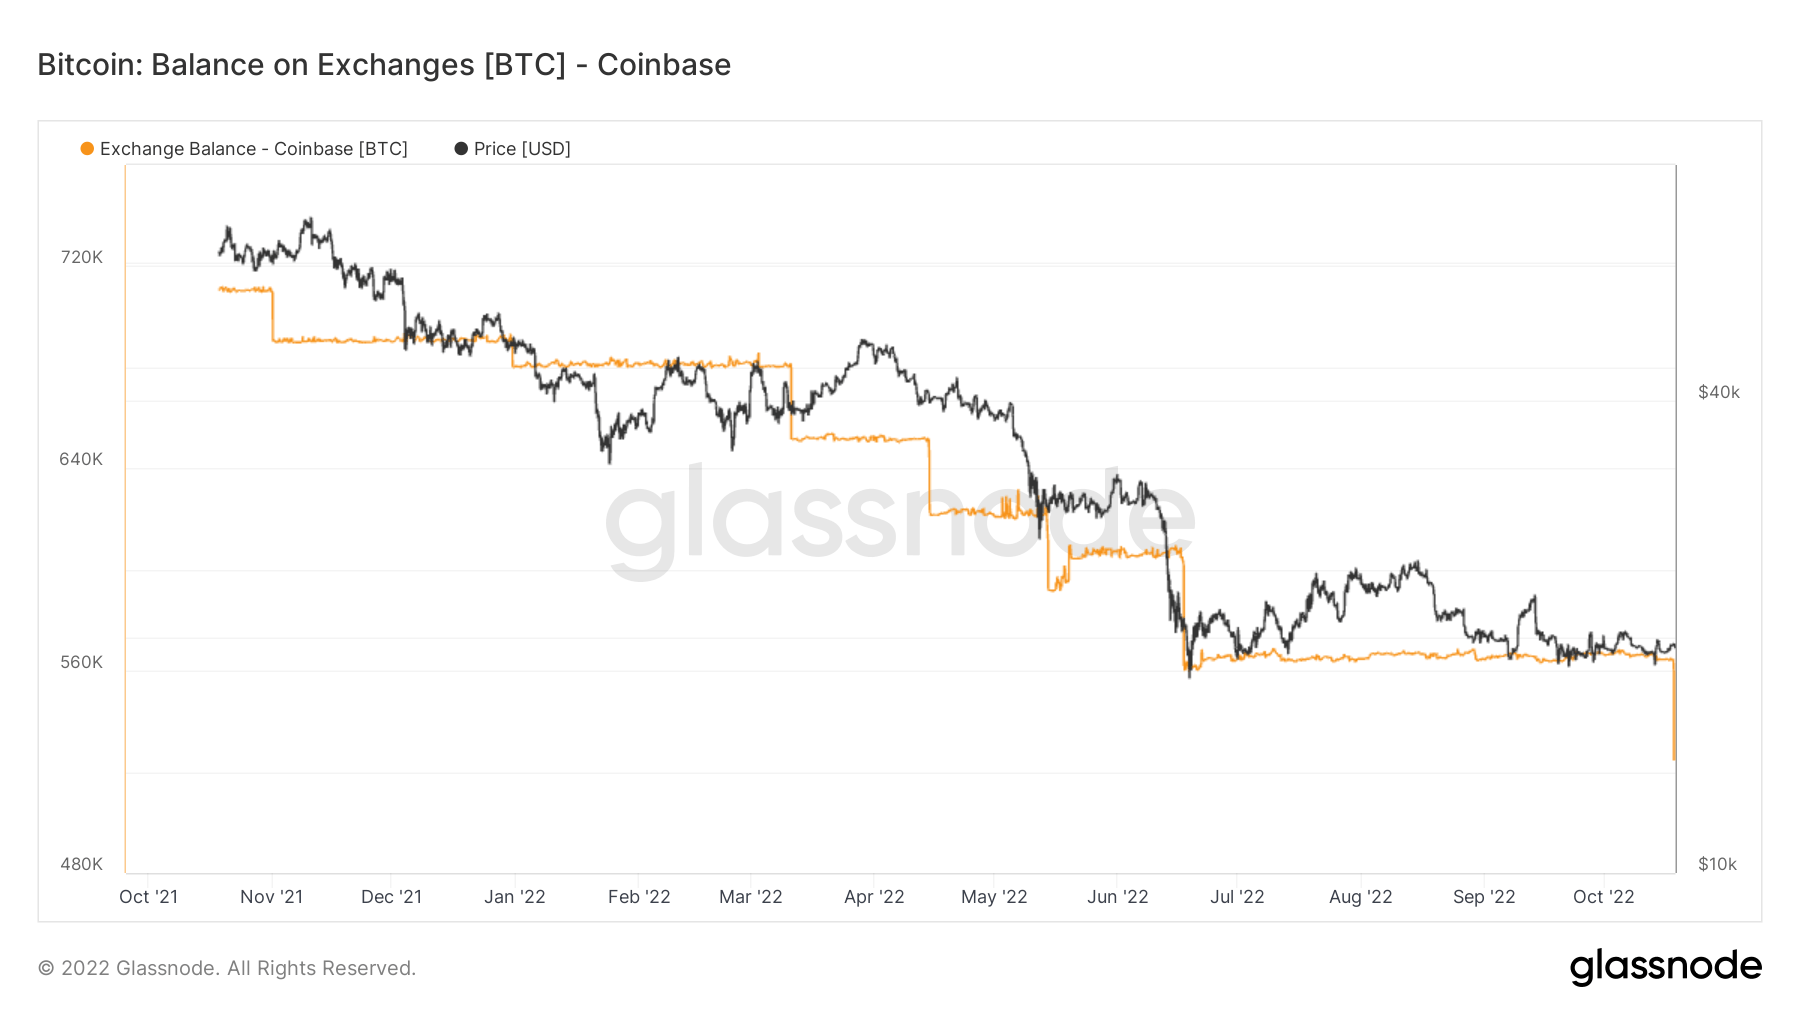
Since the November 2021 bull run, a minimal amount of Bitcoins were released back onto the exchange. At the time, Coinbase held almost 4% of the total Bitcoin supply. The exchange lost 1% of total Bitcoin in nearly a year and has just under 3% of it.
Coinbase gëtt haaptsächlech vu groussen Institutiounen an den USA benotzt, déi bekannt sinn fir hir Tendenz ze kafen an ze halen. Wéi och vun der Grafik uewen bewisen ass, huet den Austausch bedeitend Quantitéite vu Bitcoin verluer nodeems de Bärenmaart getraff gouf.
Coinbase hu bal 680,000 Bitcoins am Ufank vum Joer, an déi Zuel war gefall ze 560,000 an aacht Méint am August. Den Austausch verluer weider 50,000 Bitcoins 18. Oktober, déi de Gesamtbetrag ofgehalen vun Coinbase op 525,000 erofgesat.
Geo Decompte
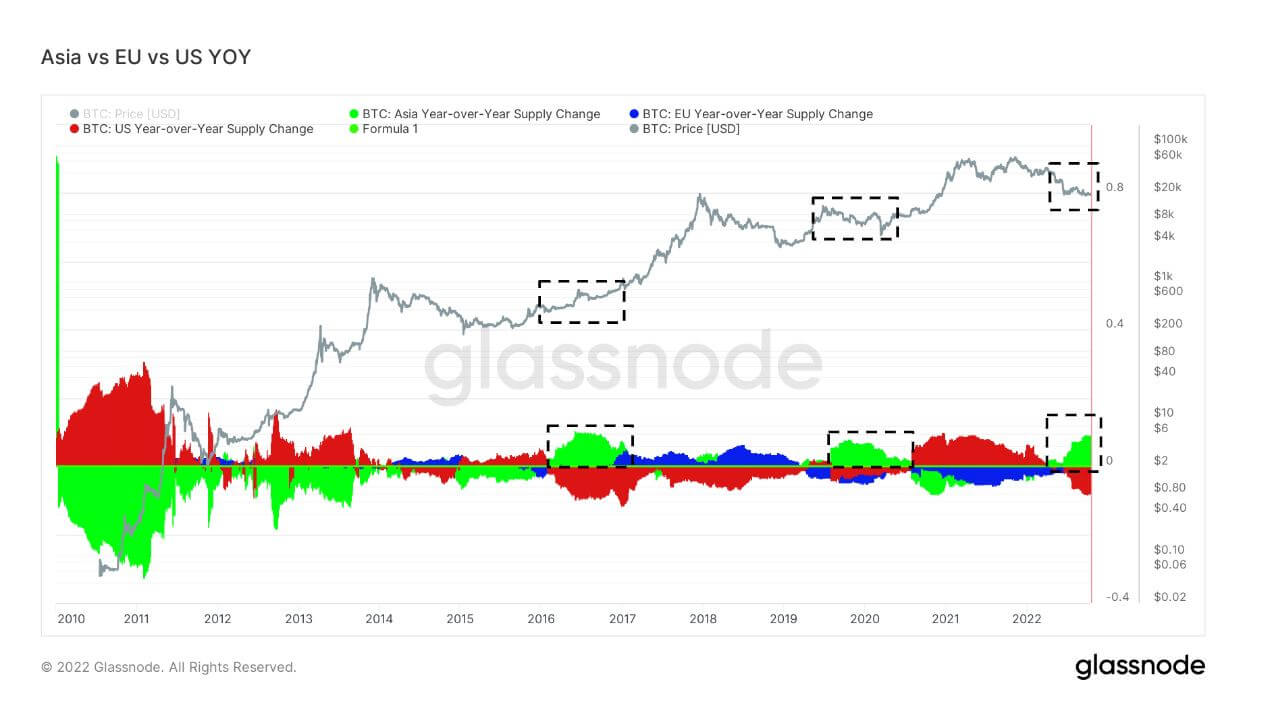
Regional Präisser ginn an engem zwee-Schrëtt Prozess konstruéiert: Éischtens, Präisbeweegunge ginn u Regiounen zougewisen baséiert op Aarbechtszäiten an den USA, Europa an Asien. Regional Präisser ginn dann festgeluecht andeems Dir déi kumulativ Zomm vun de Präisännerungen iwwer Zäit fir all Regioun berechnen.
Dës Metrik weist d'30-Deeg Ännerung vum regionale Präis festgeluecht während Asien Aarbechtszäiten, dh tëscht 8 an 8 China Standard Time (00:00-12:00 UTC). Asien 3,724 BTC -2,159 BTC (5 D)
Dës Metrik weist d'30-Deeg Ännerung vum regionale Präis, deen an der EU-Aarbechtszäit festgeluecht gouf, also tëscht 8 an 8 Zentraleuropäesch Zäit (07:00-19:00 UTC), respektiv Zentraleuropäesch Summerzäit (06:00-18:00 Auer) UTC). Europa -3,464 BTC 4,093 BTC (5 D)
Dës Metrik weist d'30-Deeg Ännerung vum regionale Präis, deen an den US-Aarbechtszäiten festgeluecht gouf, dh tëscht 8 an 8 Ostzäit (13:00-01:00 UTC), respektiv Eastern Daylight Time (12:00-0:00 UTC) . US -3,445 BTC 5,721 BTC (5 D)
When Asia buys Bitcoin, it’s usually a good time to buy Bitcoin
The last three bear markets, 2016-2017, 2019-2020, and 2022, have seen Asia’s share of BTC ownership go up. This is currently the most significant Asia premium for several years. Cryptoslate has talked about Asia becoming the smart money in the ecosystem. Looking at previous bear markets, it is apparent that Asia scoops up cheap BTC.
Kohorten
Brécht relativ Verhalen duerch Portemonnaie vun verschiddenen Entitéiten.
SOPR - De Spent Output Profit Ratio (SOPR) gëtt berechent andeems de realiséierte Wäert (an USD) gedeelt gëtt duerch de Wäert bei der Schafung (USD) vun engem verbrauchte Ausgab. Oder einfach: Präis verkaf / Präis bezuelt. Laangfristeg Holder SOPR 0.50 -16.67% (5 D)
Short Term Holder SOPR (STH-SOPR) ass SOPR deen nëmme verbraucht Ausgänge méi jonk wéi 155 Deeg berücksichtegt an als Indikator déngt fir d'Behuele vu kuerzfristeg Investisseuren ze bewäerten. Kuerzfristeg Holder SOPR 0.99 -1.00% (5 D)
Long-term holders holding down the fort
Long-term holders are defined as a cohort that has held Bitcoin longer than 155 days and is considered to be the smart money of the ecosystem. As BTC’s all-time high came in November 2021, one-year cohorts were selected over six months to show this cohort has held from a 75% drawdown and is still hodling.
During bear market cycles, LTHs accumulate while the price is suppressed after STHs have left the ecosystem as they entered for price speculation. Currently, 66% of the supply is held by LTH, which is the most amount ever; during bear markets, LTH’s collection portion grows, forming the new base for each bear market cycle.
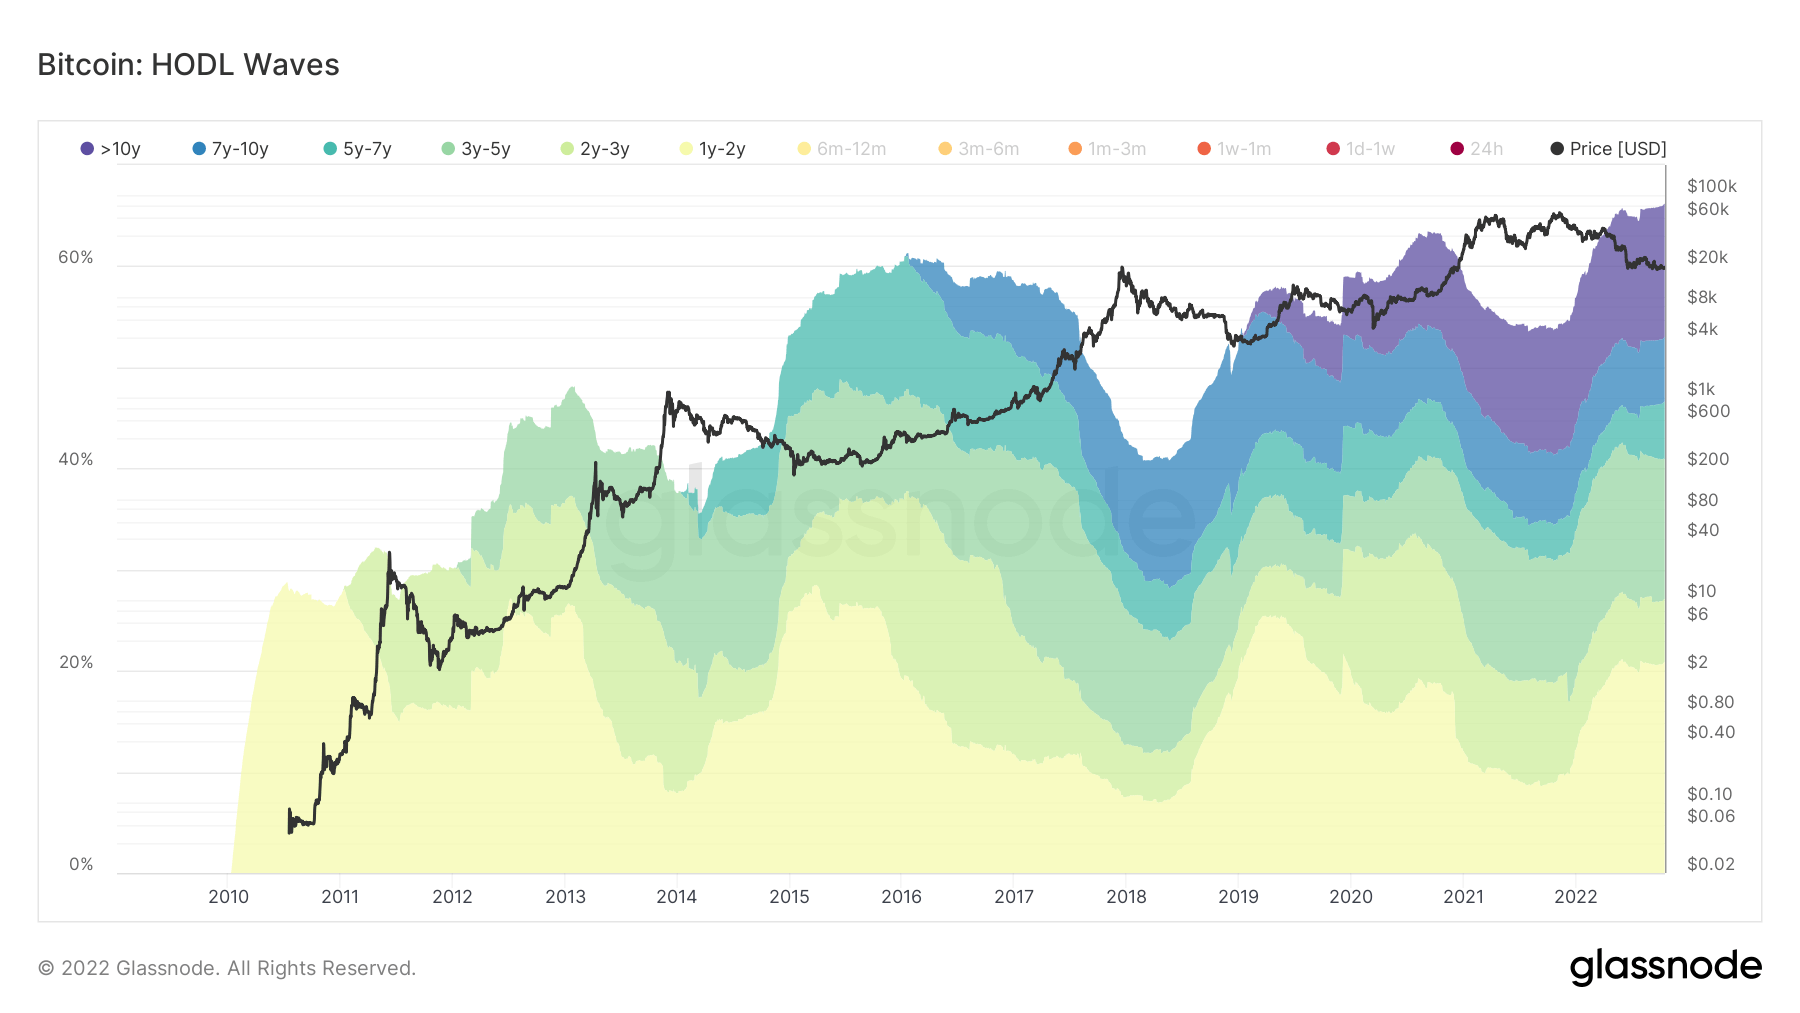
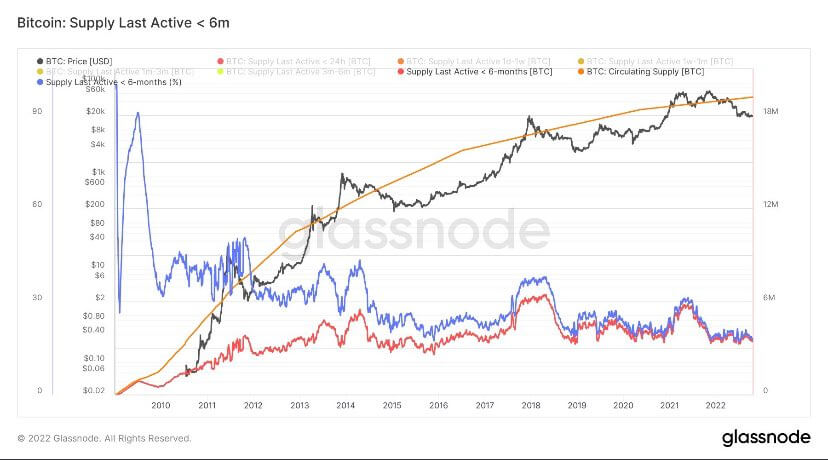
Short-term holders are at bear market lows
Short-term holders (6 months or less) are holding Bitcoin at extremely low levels, similar to previous bear market cycles. STH’s currently have around 3 million of the supply; during the 2021 bull run, this cohort got up to 6 million, and the same can be seen with the last bull run of 2017. Not all STH’s sold for fear of price; a migration occurred from STHs to LTH, which saw an increase of 10 million of the supply to 13 million across the back end of 2021.
Stablecoins
Eng Zort cryptocurrency déi vun Reserve Verméigen ënnerstëtzt gëtt an dofir Präisstabilitéit ubidden kann.
De Gesamtbetrag vun de Mënzen déi op Austauschadressen ofgehale ginn. Stablecoin Austauschbalance $ 40.14B -0.05% (5 D)
De Gesamtbetrag vun USDC ofgehalen op Austauschadressen. USDC Exchange Balance $ 1.82B -23.87% (5 D)
De Gesamtbetrag vun USDT ofgehalen op Austauschadressen. USDT Exchange Balance $ 17.09B -0.05% (5 D)
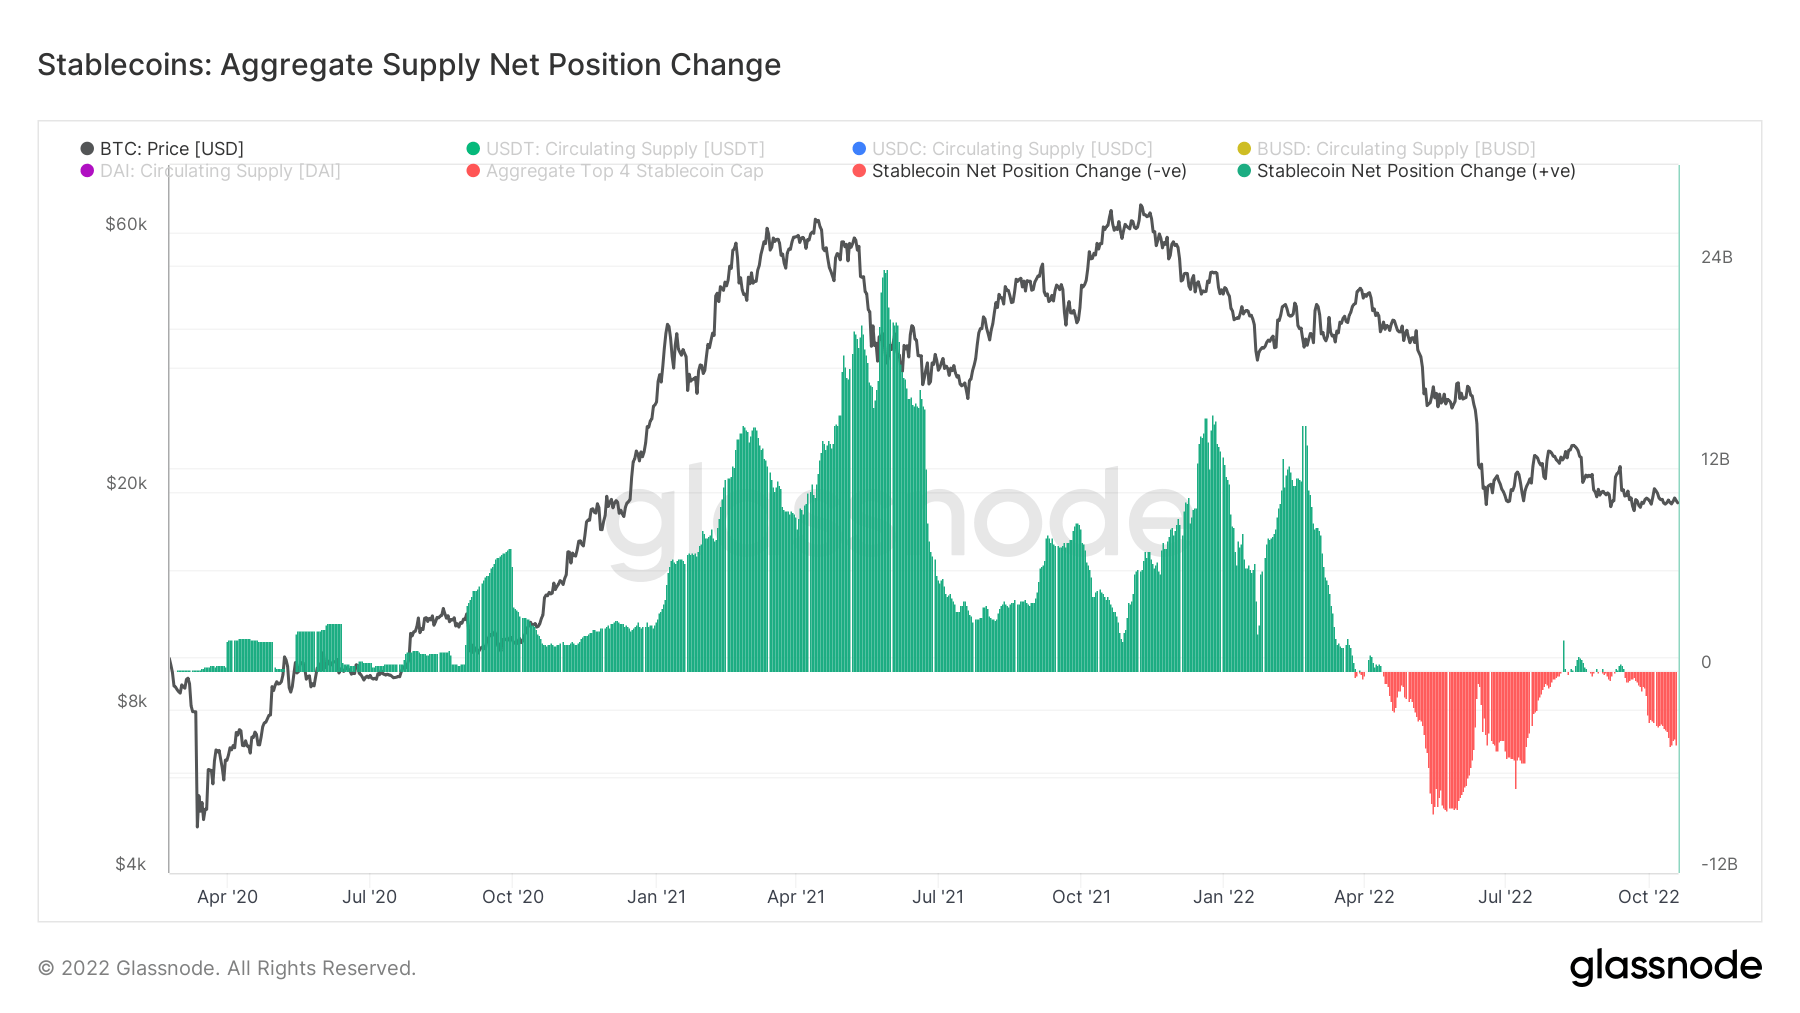
Change of regime for stablecoins
2021 was a monumental year for stablecoins, and going into 2022, the market cap of just the top 4 stablecoins alone was upwards of over $160 billion. Quite evidently, 2021 was a bubble propped up by futures and unsustainable yields. During the bull run of 2021, almost $24 billion of stablecoins were being put onto exchanges and most likely used in defi.
However, since the luna collapse, with Bitcoin dropping from $40k to $20k, distribution has been the central regime of stablecoins, at its peak of $12 billion of sell pressure. In a global deleveraging event in the macro world, selling occurs from stablecoins to fiat to make debt obligations; expect this regime to continue.
Source: https://cryptoslate.com/market-reports/weekly-macroslate-which-part-of-the-big-short-film-are-we-in-right-now-as-u-s-treasury-yields-continue-to-climb-and-invert-across-the-yield-curve/