

Maacht mat bei Hëllefe profitéieren Kanal fir up to date ze bleiwen iwwer breaking news Ofdeckung
In today’s market, NEO / USD breaks away from the price consolidation trend that locked the market to a price level of $8.50000. The buying pressure in today’s market was so strong that the price reached above the height of $9.50000. Although at that point some traders began to sell, we can be sure that the market is resuming its up-trend judging from the bullish momentum.
NEO Market Price Statistic:
- NEO/USD price now: $9.293969
- NEO/USD market cap: $ 656,682,478
- NEO/USD circulating supply: 70,538,831.00
- NEO/USD total supply:100,000,000,000
- NEO/USD coin market ranking: #63
Schlëssel Niveauen
- Resistenz: $ 9.50000, $ 10.00000, $ 10.500000
- Ënnerstëtzung: $ 8.258514, $ 8.000000, $ 7.500000


Äert Kapital ass a Gefor
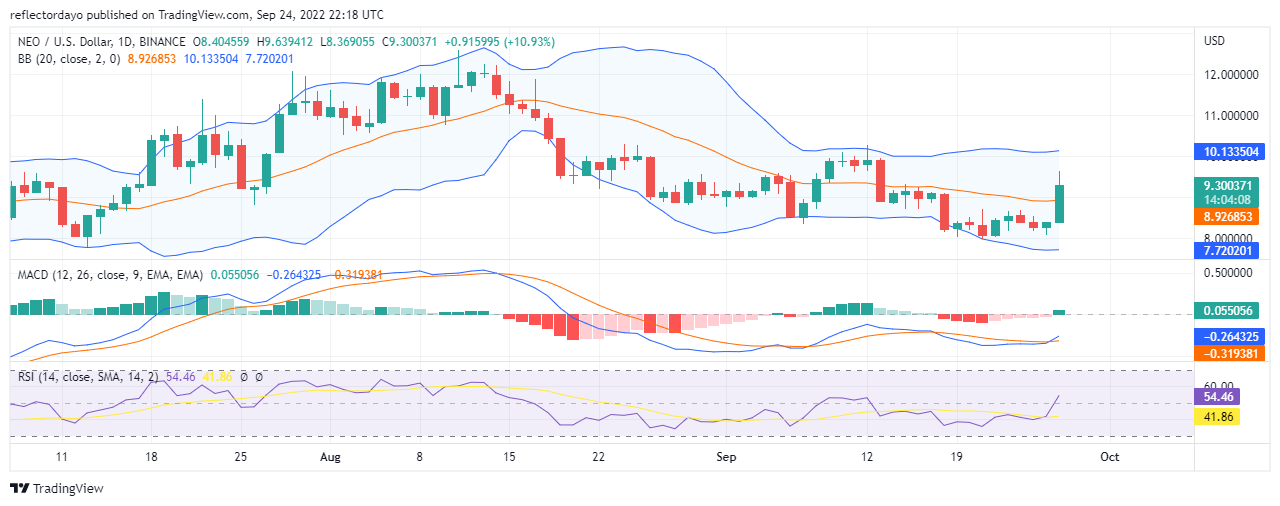
NEO Market Price Analysis: The Indicators’ Point of View
The price of the market kept being rejected at the resistance level of $10.000000. From the 7th of September to the 9th of September, there were three very significant bullish candlestick patterns (the three white soldiers) which are sufficient enough to confirm that the bullish trend will continue for a while. But near the $10.0000 resistance level, the bullish price advancement became static as selling pressure increased. And after this, a very bearish market move followed. But, because the Market is tending to an uptrend, the price consolidates after the 18th September bearish move in the market.
After the September 18th bearish market, the MACD histograms (which are negative histograms) began to show weakness in the bearish market. In addition to that, the weak bearish histogram began to reduce in height until today’s very bullish market gave the indicator a bullish histogram. The two lines of the MACD have crossed below zero levels. After this, it is expected that the lines will seek higher levels. The RSI also behaved similarly. In the MACD, the two lines still need to cross above level zero for bulls to be in control of the market.
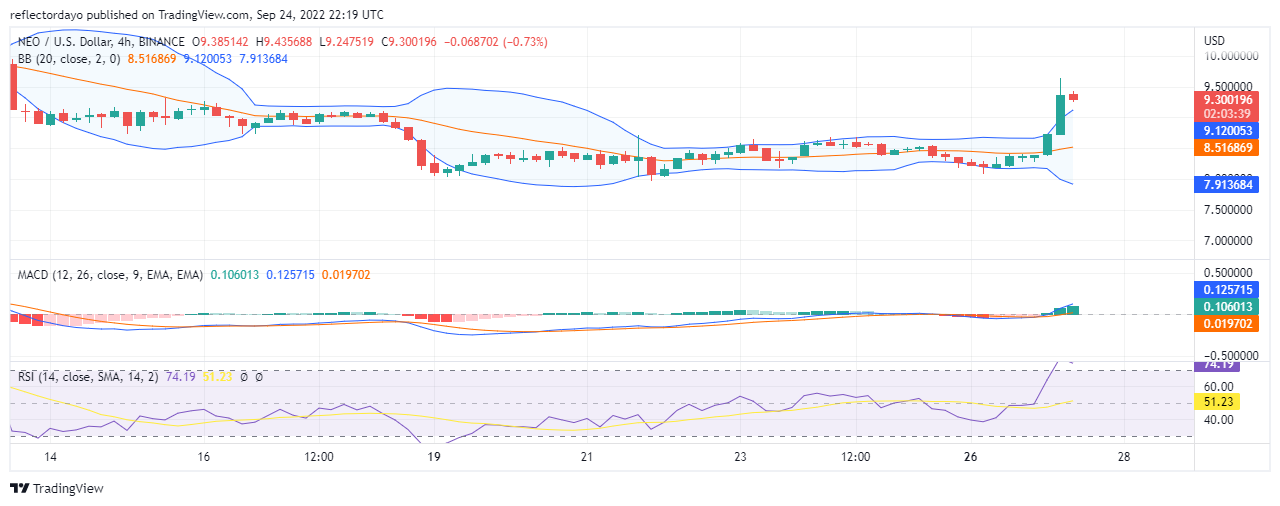
NEO / USD 4-Stonne Chart Ausbléck
The bulls were almost in total control of the first trading session of today. And also, The buying pressure increased greatly in the second session. But towards the end of the second session, traders begin to sell. And as a result of this price pullback in the market, the market has balanced at around the current price. The RSI indicator shows that the price retracement is a result of the market entering into the overbought territory. The trend may continue after the pullback.
Tamadoge - Spill fir Meme Coin ze verdéngen

- Verdéngt TAMA a Schluechte mat Doge Hausdéieren
- Capped Versuergung vun 2 Milliarden, Token Burn
- Virverkaf huet $ 19 Milliounen an ënner zwee Méint gesammelt
- Upëff ICO op OKX Exchange
Maacht mat bei Hëllefe profitéieren Kanal fir up to date ze bleiwen iwwer breaking news Ofdeckung
Source: https://insidebitcoins.com/news/neo-price-analysis-for-27th-of-september-neo-usd-breaks-9-0000-resistance-level