Cryptocurrencies are making positive moves as altcoins break out above 21-day moving average lines. However, demand is drying up at higher price levels. Bears are relentless as they sell on every rally.
D'Sandbox
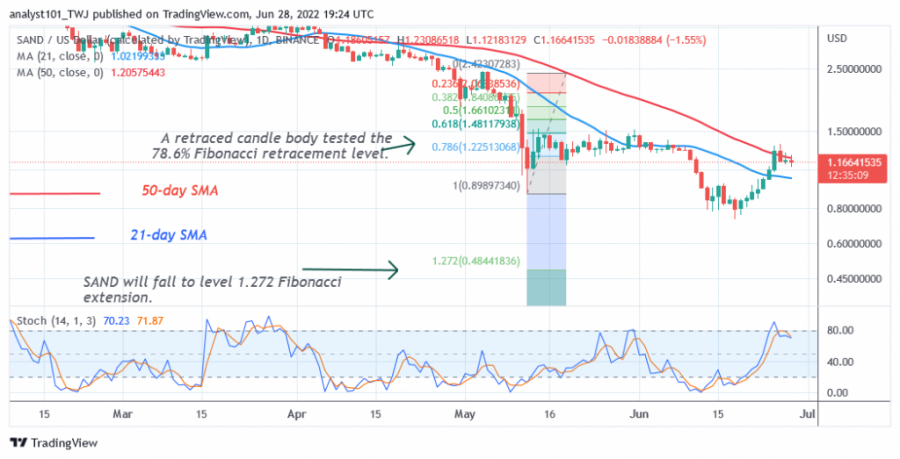
The price of the Sandbox (SAND) is in a downtrend, but is making an upward correction to the previous highs. The bulls broke through the moving averages but failed to maintain the uptrend. The price of the cryptocurrency has fallen below the 50-day line SMA while resuming its sideways movement. SAND fluctuates between the moving averages. The market will develop a trend when the moving average lines are broken.
In the meantime, the price of the cryptocurrency fluctuates between the moving average lines. The downtrend will resume when the price breaks below the 21-day line SMA. SAND/USD is below the 80% area of the daily stochastic. This indicates that the altcoin is in a bearish momentum.
The market was previously in the overbought zone. Sellers will emerge and push prices down. It is the best performing cryptocurrency asset in the past week. It has the following characteristics:
Präis: $1.18
Maart Kapitaliséierung: $3,525,797,824
Handelsvolumen: $379,806,180
7 Deeg Gewënn: 26.88%
Polygon
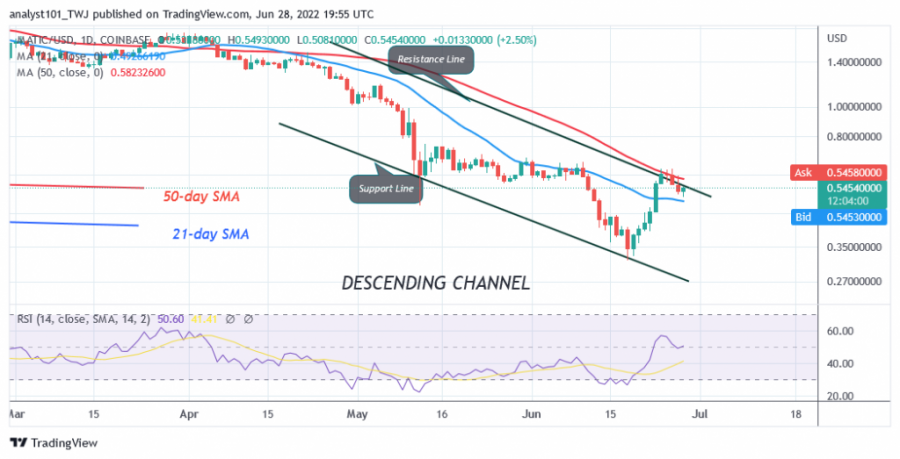
Polygon (MATIC) is in a downtrend but recovered when it crossed the 21-day line SMA. During the upward correction, the bulls failed to overcome the 50-day line SMA. It fluctuates between the moving average lines. Polygon will resume its uptrend when the price is above the 50-day line SMA. The altcoin will continue to rise to the highs of $0.90 and $1.20.
On the other hand, if the altcoin falls below the 21-day line SMA, it will drop back to the previous low at $0.31. Polygon is at level 51 of the Relative Strength Index period 14, indicating that there is a balance between supply and demand. MATIC is the cryptocurrency with the second best performance last week. It has the following characteristics:
Präis: $0.5483
Maart Kapitaliséierung: $5,483,313,920
Handelsvolumen: $571,840,087
7 Deeg Gewënn: 26.36%
Compound
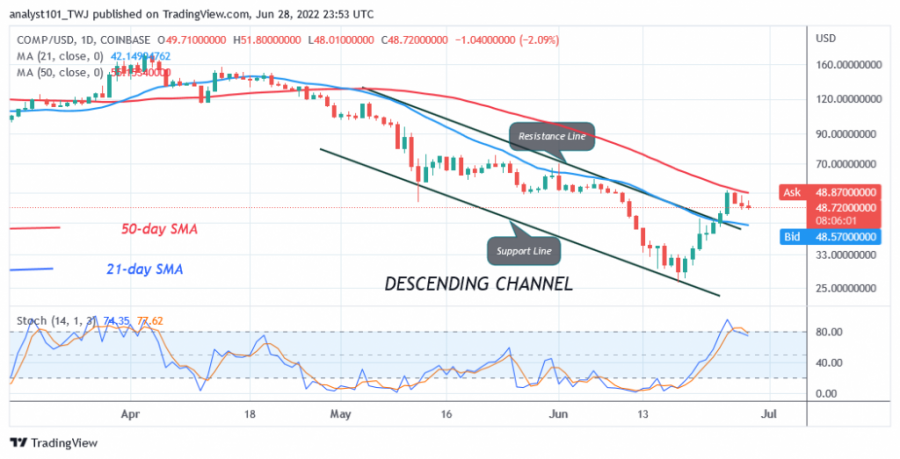
Compound (COMP) is in a downtrend but has resumed its upward correction. The bullish momentum has crossed the 21-day line SMA but is stuck below the 50-day line SMA. The cryptocurrency is now in a range-bound move between the moving averages. The altcoin is trading between the moving average lines. The altcoin will resume an uptrend if the bulls break out above the 50-day line SMA.
A rally to $95 is expected. If the bears break below the 21-day line SMA, COMP will fall back to the previous low of $26. The altcoin continues to trade between the moving averages with unbroken ranges. COMP/USD is above the 80% range of the daily stochastic. This indicates that the market has reached the overbought zone. COMP is the cryptocurrency with the third best performance in the past week. It has the following characteristics:
Präis: $50.79
Maart Kapitaliséierung: $507,086,899
Handelsvolumen: $99,369,922
7 Deeg Gewënn: 21.09%
STEPN
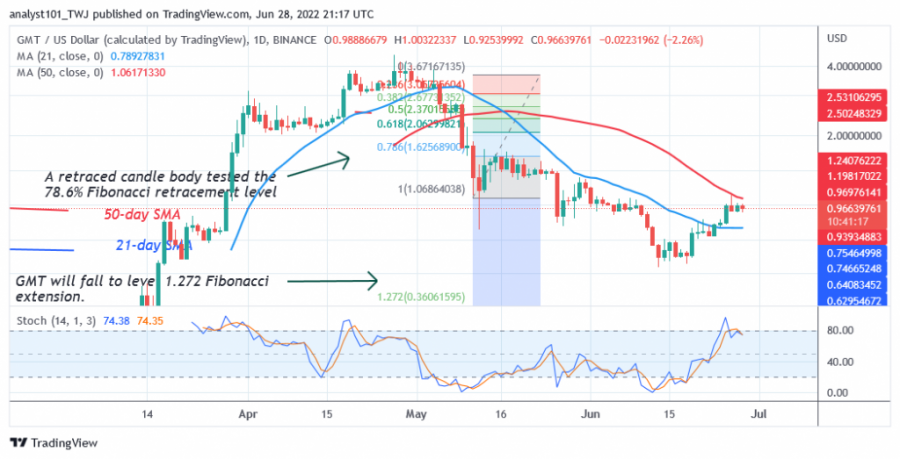
STEPN (GMT) is in a downtrend, but the cryptocurrency’s price has risen above the 21-day line SMA. The bullish momentum has settled below the 50-day line SMA. The price of the cryptocurrency fluctuates between the moving average lines. GMT will develop a trend when the moving average lines are broken. The uptrend will resume when the 50-day line is broken. The market will rally to the high of $3.83.
However, GMT is above the 80% area of the daily stochastic. This indicates that the market has reached the overbought area. Sellers will emerge and push prices down. It is the cryptocurrency with the fourth best performance last week. It has the following characteristics:
Präis: $0.9749
Maart Kapitaliséierung: $5,849,501,498
Handelsvolumen: $409,164,784
7 Deeg Gewënn: 18.65%
Kaffi
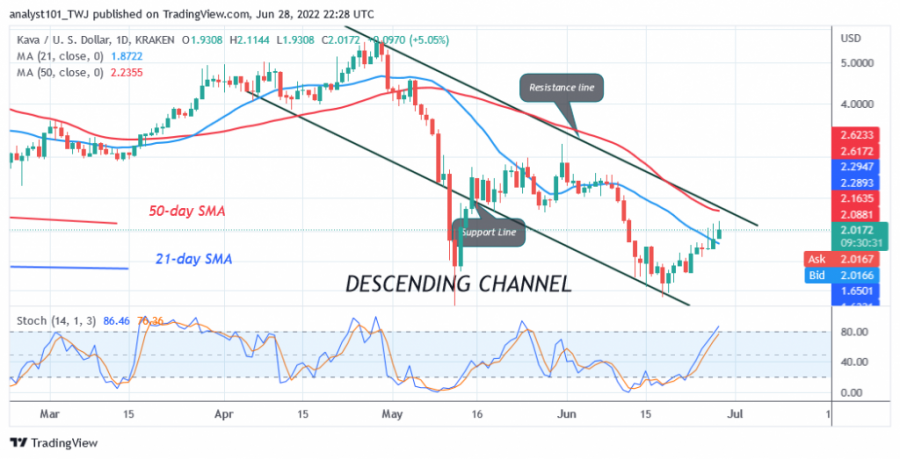
Kava (KAVA) is in a downtrend as the price breaks above the 21-day line SMA. The cryptocurrency value is above the 21-day line SMA, but below the 50-day line SMA. Further upward movement of the altcoin is unlikely as the market reaches an overbought zone.
The price of the cryptocurrency is above the 80% area of the daily stochastic. This indicates that Kava has reached the overbought area of the market. The coin could fall to the previous low of $1.39. It is the cryptocurrency with the fifth best performance last week. It has the following characteristics:
Präis: $2.02
Maart Kapitaliséierung: $454,068,797
Handelsvolumen: $140,690,644
7 Deeg Gewënn: 17.48%
Verzichterklärung. Dës Analyse a Prognose sinn déi perséinlech Meenungen vum Autor a sinn net eng Empfehlung fir Krypto Währung ze kafen oder ze verkafen a sollten net als Entschiedegung vu CoinIdol ugesi ginn. D'Lieser sollen hir eege Fuerschung maachen ier se Fongen investéieren.
Source: https://coinidol.com/altcoins-bulls-purchase-dips/
