TL; DR
- Liz Truss became the U.K. Prime Minister on Sept. 6 as the country prepares for a possible recession in Q4.
- European Central Bank has increased interest rates by 75bps, a record, but they are still way behind the inflation curve at 9.1%
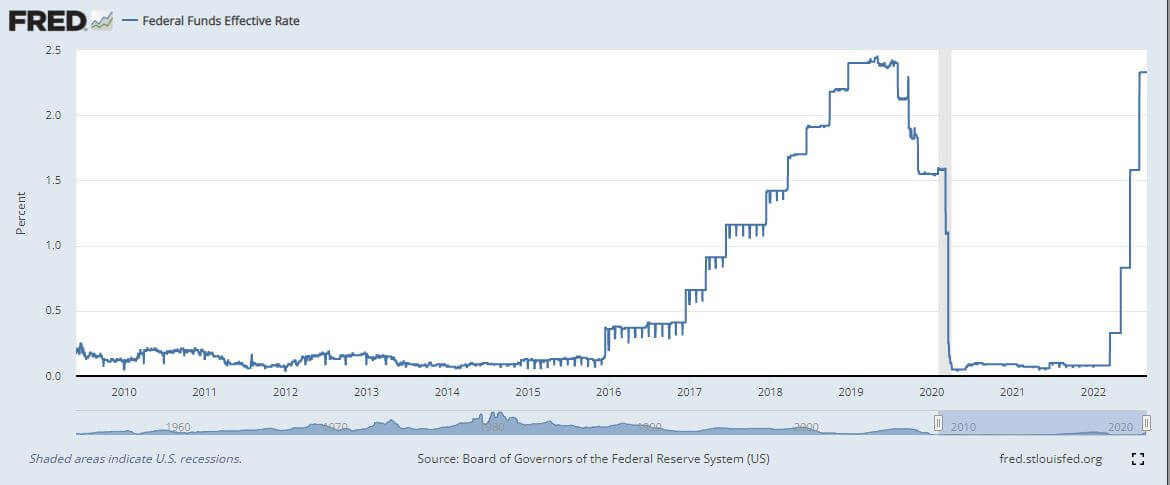
- The market is pricing in a 75bps rate hike in the September FOMC meeting as the most likely outcome due to the tight labor market
- Russia indefinitely suspends Nord Stream gas pipeline to Europe
- Gazprom and CNPC agree on the transition to making payments for gas supplies to China in Rubles and Yuan
- Bitcoin dropped below $20,000 for the first time since early July
- Bitcoin’s correlation to the S&P 500 remains strong
- Russia is working with several friendly countries on cross-border settlements in stablecoins
Macro Iwwersiicht
Economy in peril
Liz Truss took charge as prime minister amid a potential recession from double-digit inflation and record increases in the cost of living. She is at the helm of a government with deteriorating finances, partly due to the sterling at a 37-year low and soaring payments on index-linked gilts.
Truss has promised tax cuts and additional stimulus checks — a £130 billion plan to freeze U.K. power bills and choke inflation, most likely leading to higher long-term inflation.
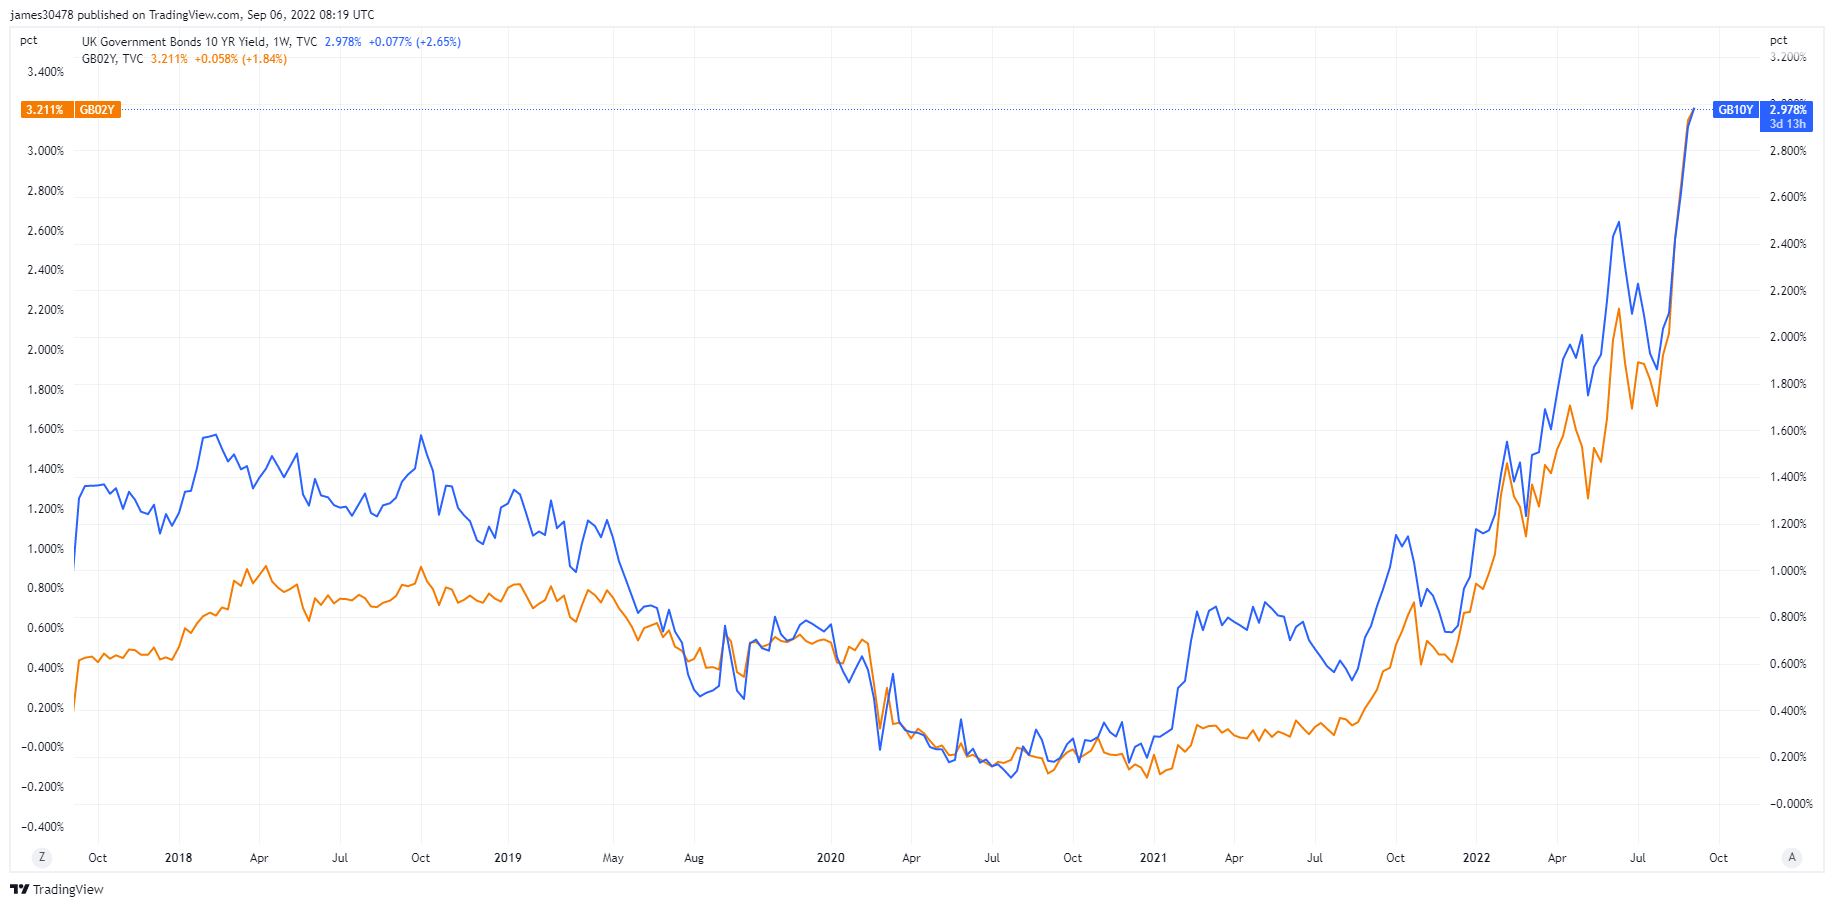
As gilt yields continued to climb higher at the front end, the 2-year gilt rose to a 14-year high, and the 10-year gilt climbed past 3% for the first time since 2014.
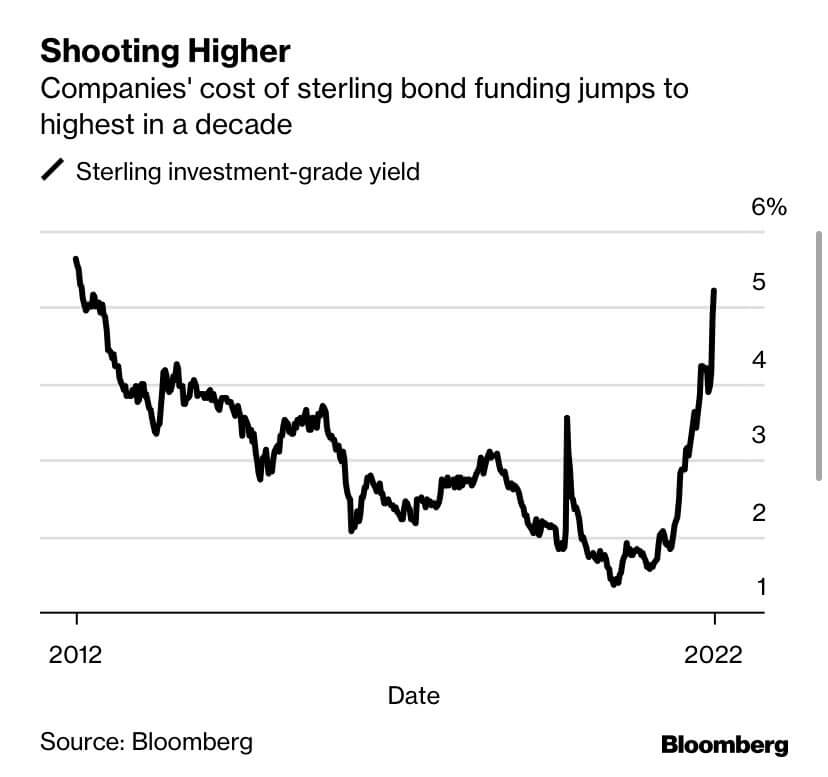
A subsidy of £130 billion to keep household energy bills below £2,500 equals roughly 5% of the U.K. GDP. Such a hefty subsidy will likely increase energy prices, drive up business sectors’ costs, and cause corporate debt yields to soar.
Europe struggles on
Europe continues to limp on following the ECB’s latest 75 bps interest rate hike. The euro is battling to get above parity against the U.S. dollar.
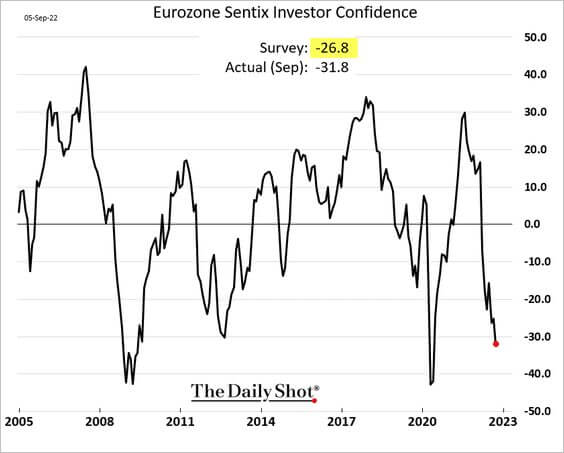
Investor confidence in the eurozone showed little to no improvement, as the Sentix survey shows a decline of almost 7 points to -31.8 — similar levels seen during the covid pandemic and the 2008 financial crisis.
Leaders around the eurozone are discussing aid packages; Germany is preparing a $65 billion inflation relief package, which requires massive debt monetization from the ECB to contain spreads and ease conditions, leading to more debasement.
Korrelatiounen
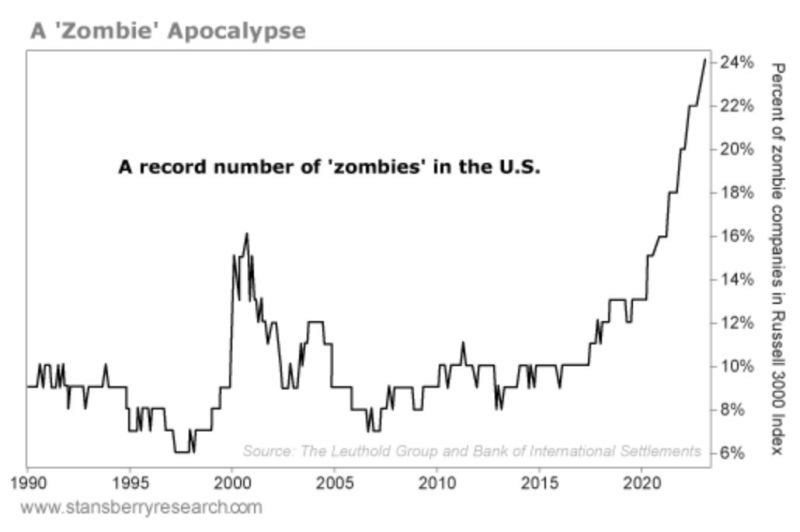
Eng Zombie Apokalypse
Nearly 25% of U.S. businesses are “zombie companies.” The previous record for zombies was 17%, set back in 2001. These companies have survived off near-zero interest rates and don’t generate cash to pay interest on their debts. They are a result of artificially low yields in the U.S.
It would be pretty hard for these companies to survive in a rising yield environment, which would end up triggering mass unemployment.
Currently, the unemployment rate is 3.7%. A double-digit unemployment rate was last seen during the recessions caused by the 2008 housing crash and covid.
According to Jim Walker, chief economist at Aletheia Capital:
“If the markets determined the interest rates then you would have never gone to the levels of zero interest rates that central bankers have been pushing that ended ensuing zombie companies.”
Aktien & Volatilitéit Gauge
De Standard and Poor's 500, oder einfach de S&P 500, ass e Börseindex, deen d'Aktieleistung vu 500 grousse Firmen op den Austausch an den USA verfollegt. S&P 500 4,067 4% (7 D)
Den Nasdaq Stock Market ass eng amerikanesch Bourse baséiert zu New York City. Et ass op der zweeter Plaz op der Lëscht vun de Boursen no der Maartkapitaliséierung vun den gehandelte Aktien, hannert der New York Stock Exchange. NASDAQ 12,681 4% (7 D)
De Cboe Volatility Index, oder VIX, ass en Echtzäitmaartindex deen d'Erwaardunge vum Maart fir d'Volatilitéit an den nächsten 30 Deeg representéiert. Investisseuren benotzen de VIX fir den Niveau vum Risiko, Angscht oder Stress um Maart ze moossen wann Dir Investitiounsentscheedungen maacht. VIX 23 -9% (7 D)
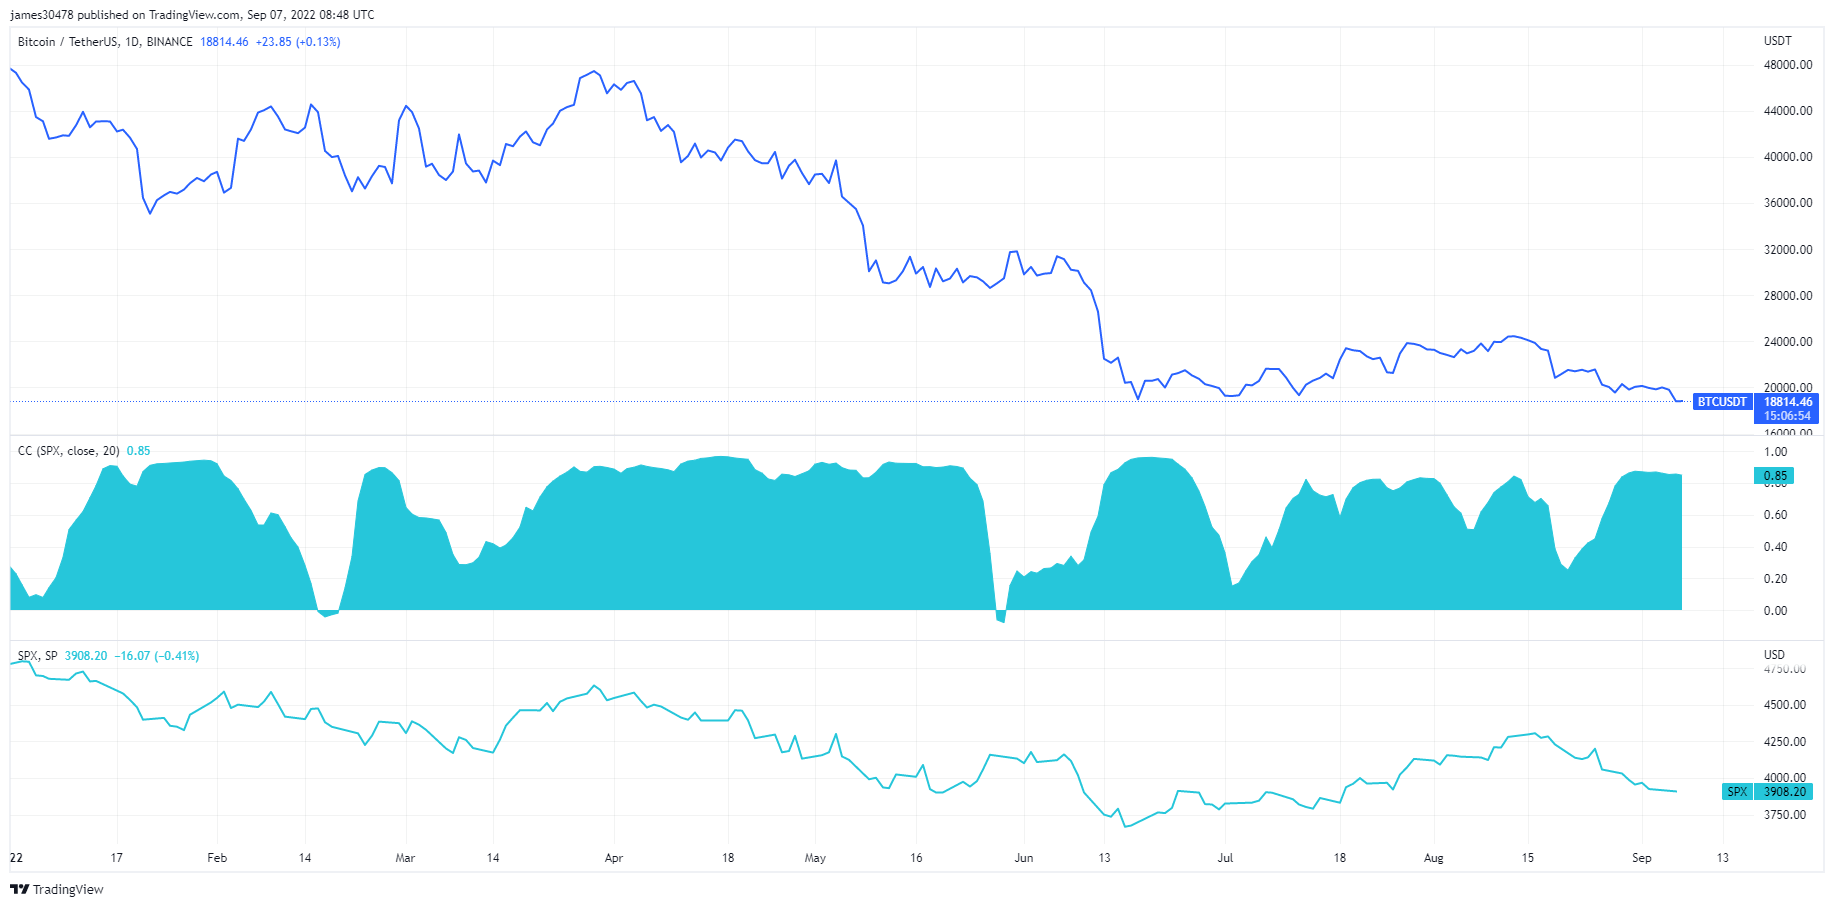
S&P and Bitcoin tied at the hip
Fed speakers tried to talk the equities market down during the week commencing Sept. 5 and only made things worse as equities marched higher.
The FOMC meeting slated for late September currently has an 86% probability of a 75 basis point hike rate.
U.S. equities continue to remain tightly correlated with BTC. For most of 2022, Bitcoin and the S&P500 have been in a tight correlation with one another. Currently, the S&P500 is 19% off its all-time high, but if stocks fall, we expect to see new lows for Bitcoin.
COMMODITIES
D'Demande fir Gold gëtt festgeluegt duerch d'Quantitéit u Gold an den Zentralbankreserven, de Wäert vum US-Dollar, an de Wonsch Gold als Hedge géint Inflatioun a Währungsdevaluatioun ze halen, all hëllefen de Präis vum Edelmetall ze féieren. Goldpräis $1,724 1.0% (7 D)
Ähnlech wéi déi meescht Commodities, gëtt de Sëlwerpräis duerch Spekulatioun an Offer an Nofro bestëmmt. Et ass och beaflosst vu Maartbedéngungen (grouss Händler oder Investisseuren a Kuerzverkaaf), industriell, kommerziell a Konsumentefuerderung, Hedge géint finanzielle Stress, a Goldpräisser. Sëlwer Präis $19 5.8% (7 D)
De Präis vum Ueleg, oder den Uelegpräis, bezitt sech allgemeng op de Spotpräis vun engem Faass (159 Liter) Benchmark Rohöl. Brutto Uelegpräis $87 -1.5% (7 D)
Move over ESG, demand for coal is soaring
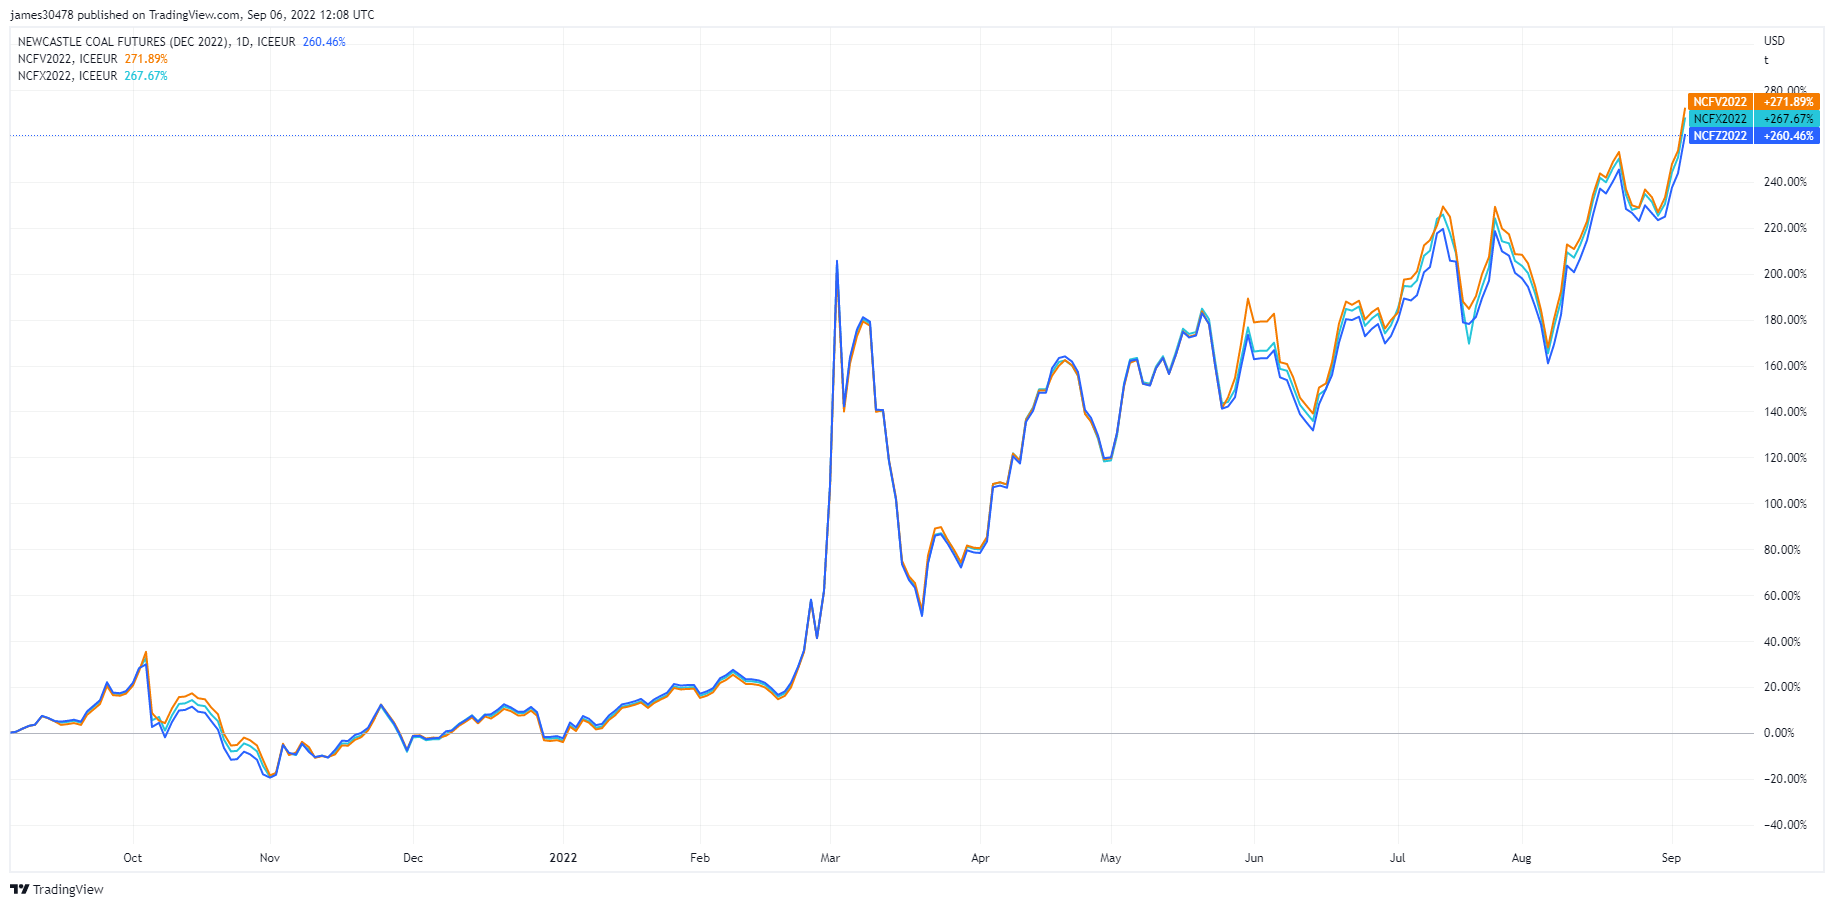

Asia Coal Futures. (Source: TradingView)Last week, we observed the energy futures market, this week it’s coal futures. The price of coal in Asia (spot Newcastle benchmark) surged to an all-time high of $440 per metric tonne. The graph observes the future price for October, November and December 2022. Coal prices in Asia rally to a record as the global hunt for fuel escalates. Utilities look to coal to replace liquified natural gas which has become too expensive to obtain.
D'Fakten
- Spot physical coal loaded at Australia’s Newcastle port was priced at $436.71/ton, a record. That’s nearly triple the price this time last year.
- Newcastle futures for October jumped 5% to $463.75/ton Monday, the highest price in data stretching back to January 2016
How much have energy prices increaased in the last year:
- European natural gas futures: + 335%
- Asian LNG spot: + 255%
- European coal futures: + 180%
- Asian coal spot: + 157%
Tariffer & Währung
Den 10-Joer Treasury Note ass eng Scholdverpflichtung ausgestallt vun der US Regierung mat enger Reife vun 10 Joer no der éischter Emissioun. Eng 10-Joer Treasury Note bezilt Zënsen mat engem fixen Taux eemol all sechs Méint a bezilt de Gesiichtswäert un den Inhaber bei der Reife. 10Y Treasury Yield 3.3% 3% (7 D)
Den US Dollar Index ass eng Moossnam vum Wäert vum US Dollar relativ zu engem Kuerf vun auslännesche Währungen. DXY 107.8 -1.65% (7 D)
USDJPY chart in focus
The USD/JPY chart continues to make multi-decade highs, currently at 142 and climbing. The Bank of Japan (BOJ) is currently at 230% debt to GDP and a 9% deficit, and the hammer blow is that the BOJ owns 50% of government debt.
Japan is the world’s largest foreign holder of U.S. treasuries ($1.2 trillion); with a weakening yen, Japan has a further incentive to sell U.S. treasuries to defend the yen, and those sales are made to pay for energy. The yield curve control by the BOJ, not allowing the 10-year treasury to yield more than 0.25% (25bps), is causing additional pressure on the Yen.
As of Sep. 7, the 10-year yield went above 0.25%, and BOJ is forced to buy bonds with freshly printed yen to pay for supplies. Investors will have to sell bonds to avoid being paid back in depreciating yen, all while yields continue to go up further as bonds sell-off.
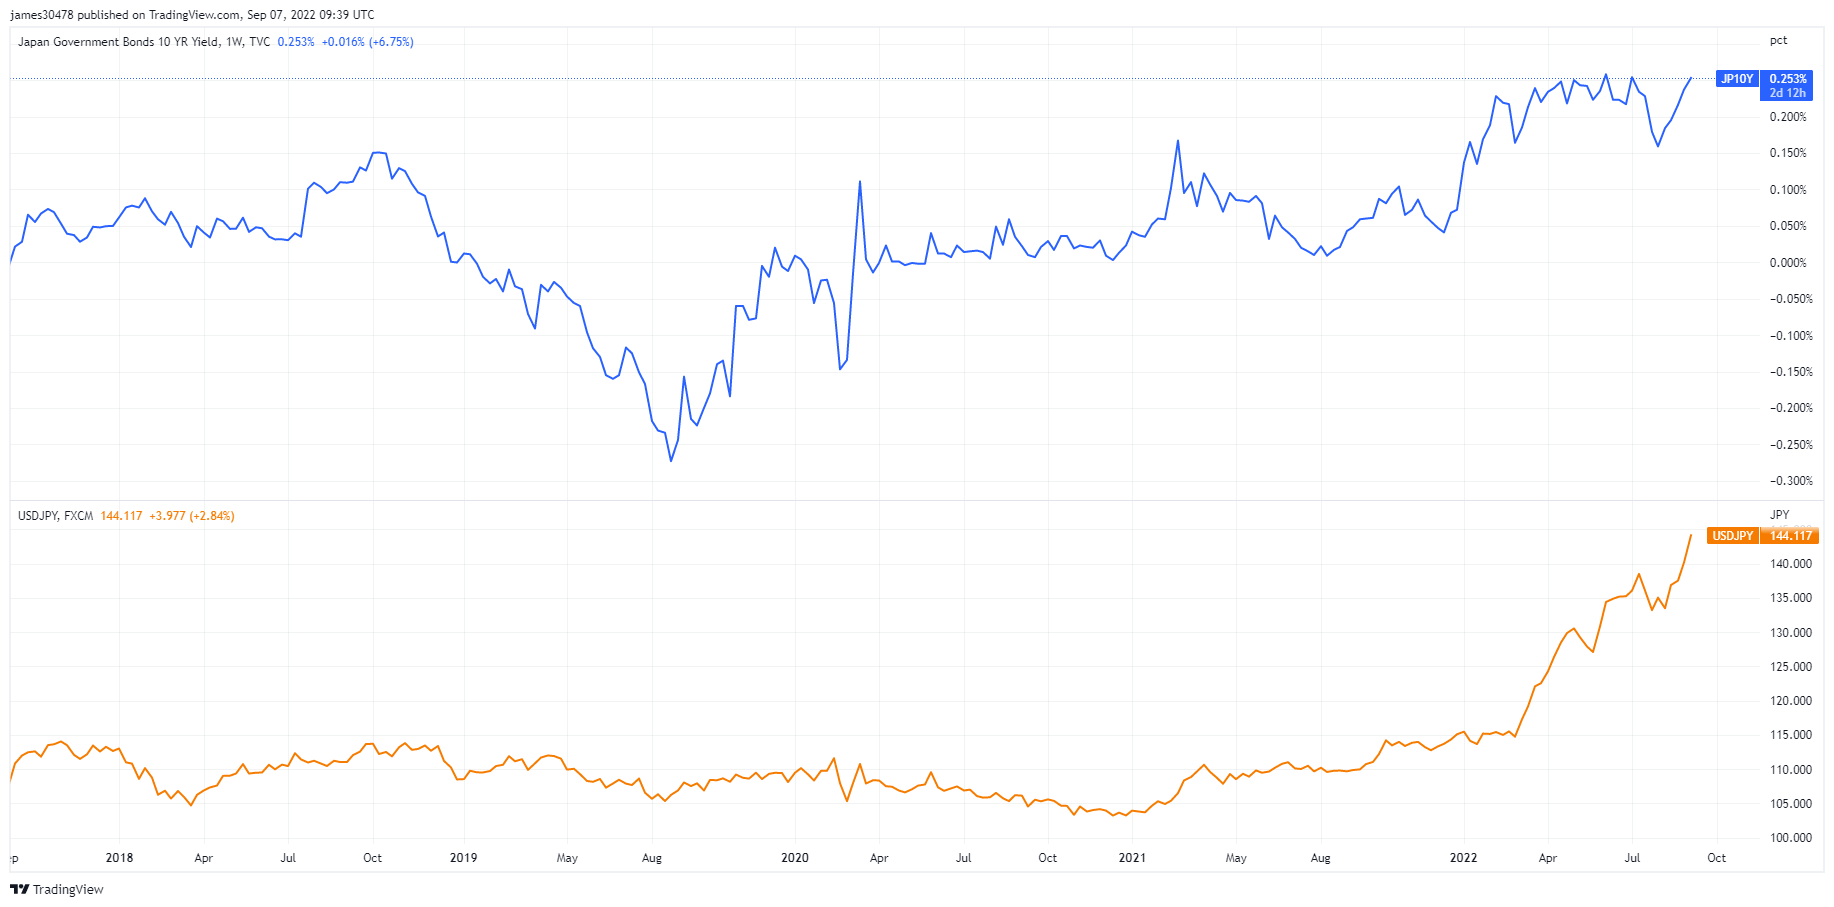
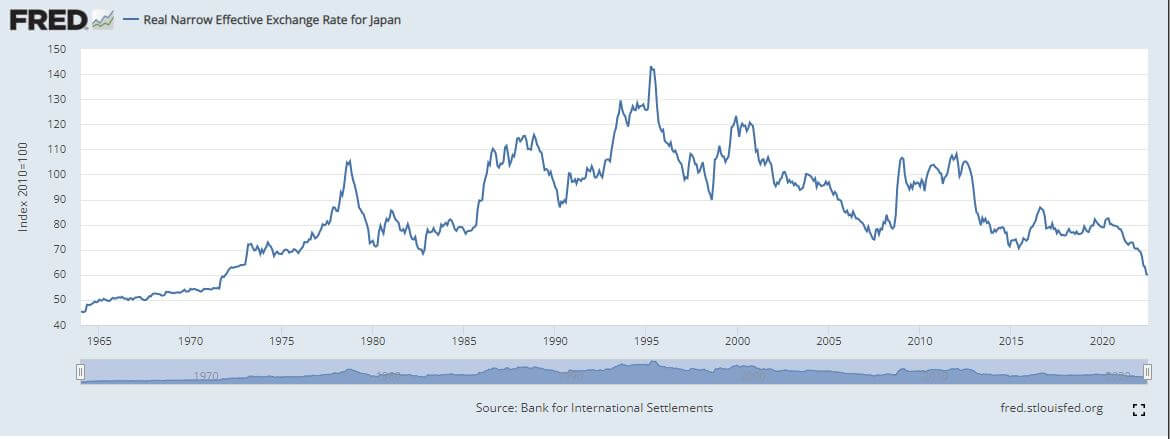
The decline in the Yen will have ripple effects throughout the global economy, as Japan is the fourth largest exporter in the world. The Real Narrow Effective Exchange Rate for Japan is at levels not seen since 1973. These sorts of moves take time to show up in asset pricing.
What’s the effect, and does it affect Bitcoin?
September is the first month of full-scale quantitative tightening by the fed, which means lower demand for U.S. treasuries, coinciding with Japan and Asia FX being down. Lower demand for USTs will equal higher U.S. bond yields and risk assets suffering.
Due to rising bond yields, this could potentially force the Fed to consider yield curve control. However, another way is for the Fed to purchase Japanese government bonds to take pressure off the BOJ.
Bond bulls trapped, debt spiral accelerates
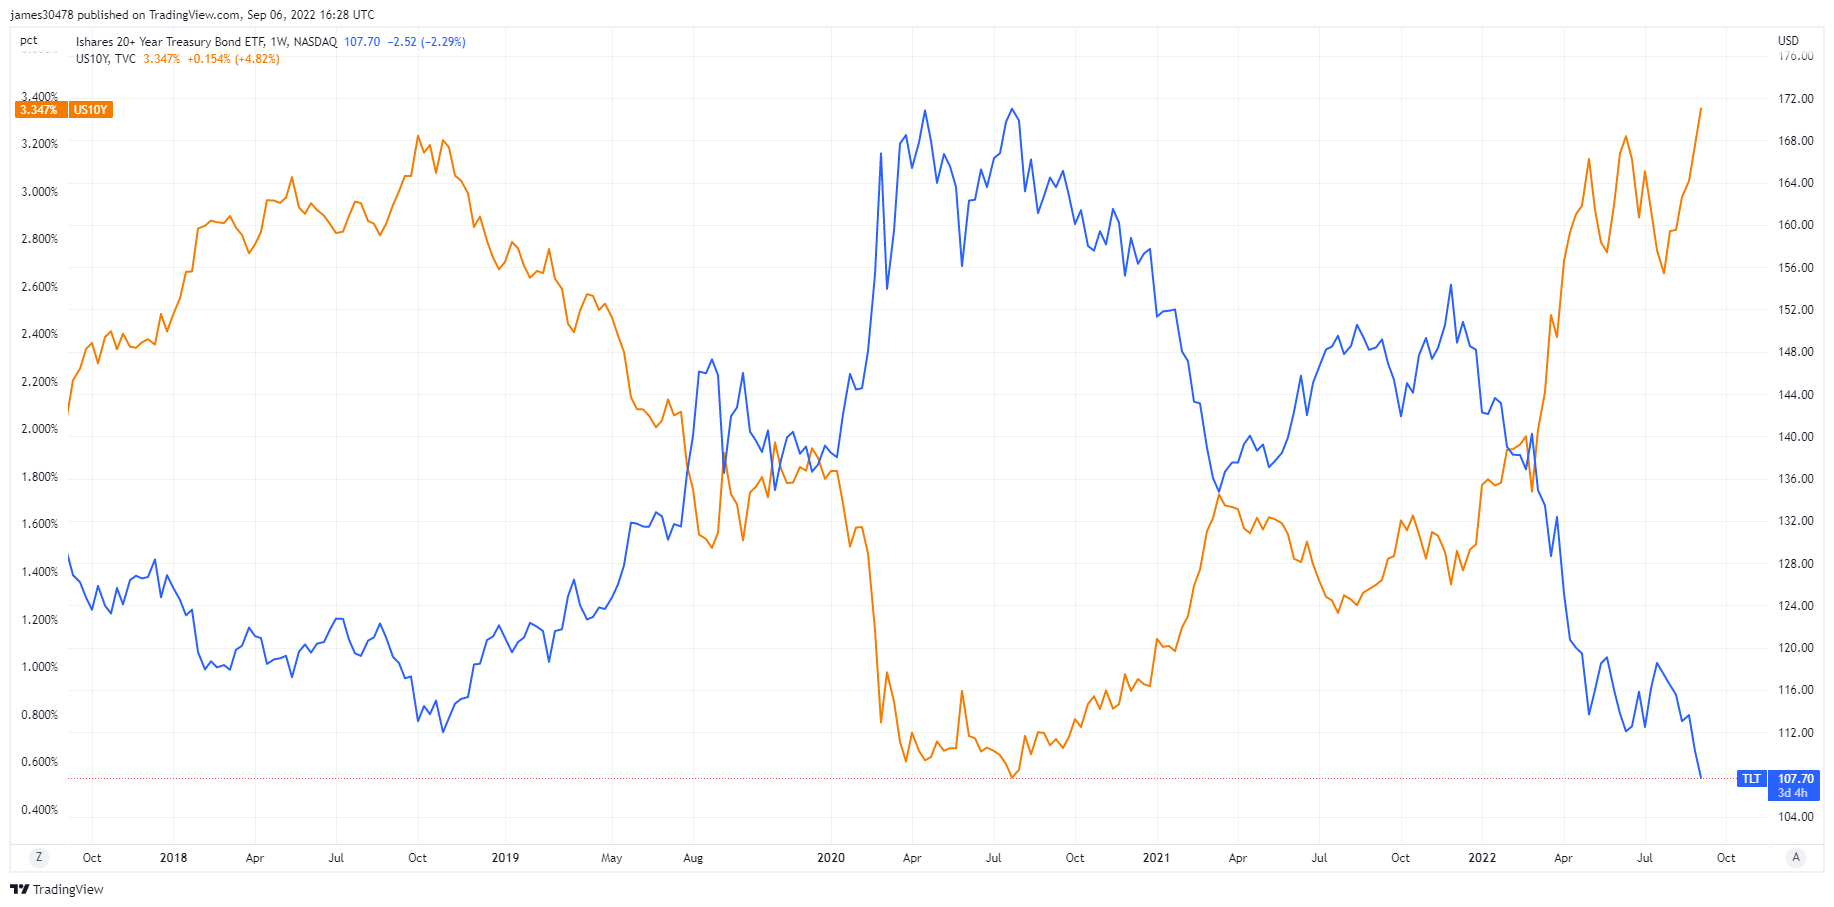
According to Investopedia, TLT is a high-quality ETF, thanks to a low expense ratio and liquidity. However, during this global deleveraging event that is occurring, bonds have been slaughtered. As the fed continues to ramp up Q.T. and the 10-year treasury pushes up towards 4%+. This translates to a debt service replacement cost of $1.2 trillion — 3x the current annual interest expense. Therefore, the U.S. is operating in a deficit as the federal debt to GDP is at 137%.
The Fed has two options, pivot and lower rates and resume quantitative easing — kicking the can down the proverbial road — or continue to let inflation hotter than 2%, raise GDP and monetize the debt.
The time frame is unknown how long this can last but politicians and governments have usually opted to kick the can down the road.
Bitcoin Iwwersiicht
De Präis vun Bitcoin (BTC) an US Dollar. Bitcoin Präis $22,040 10.60% (7 D)
D'Mooss vum Bitcoin säi Gesamtmaartkapital géint de gréissere Krypto-Währungsmarktkapital. Bitcoin Dominanz 39.29% 1.28% (7 D)
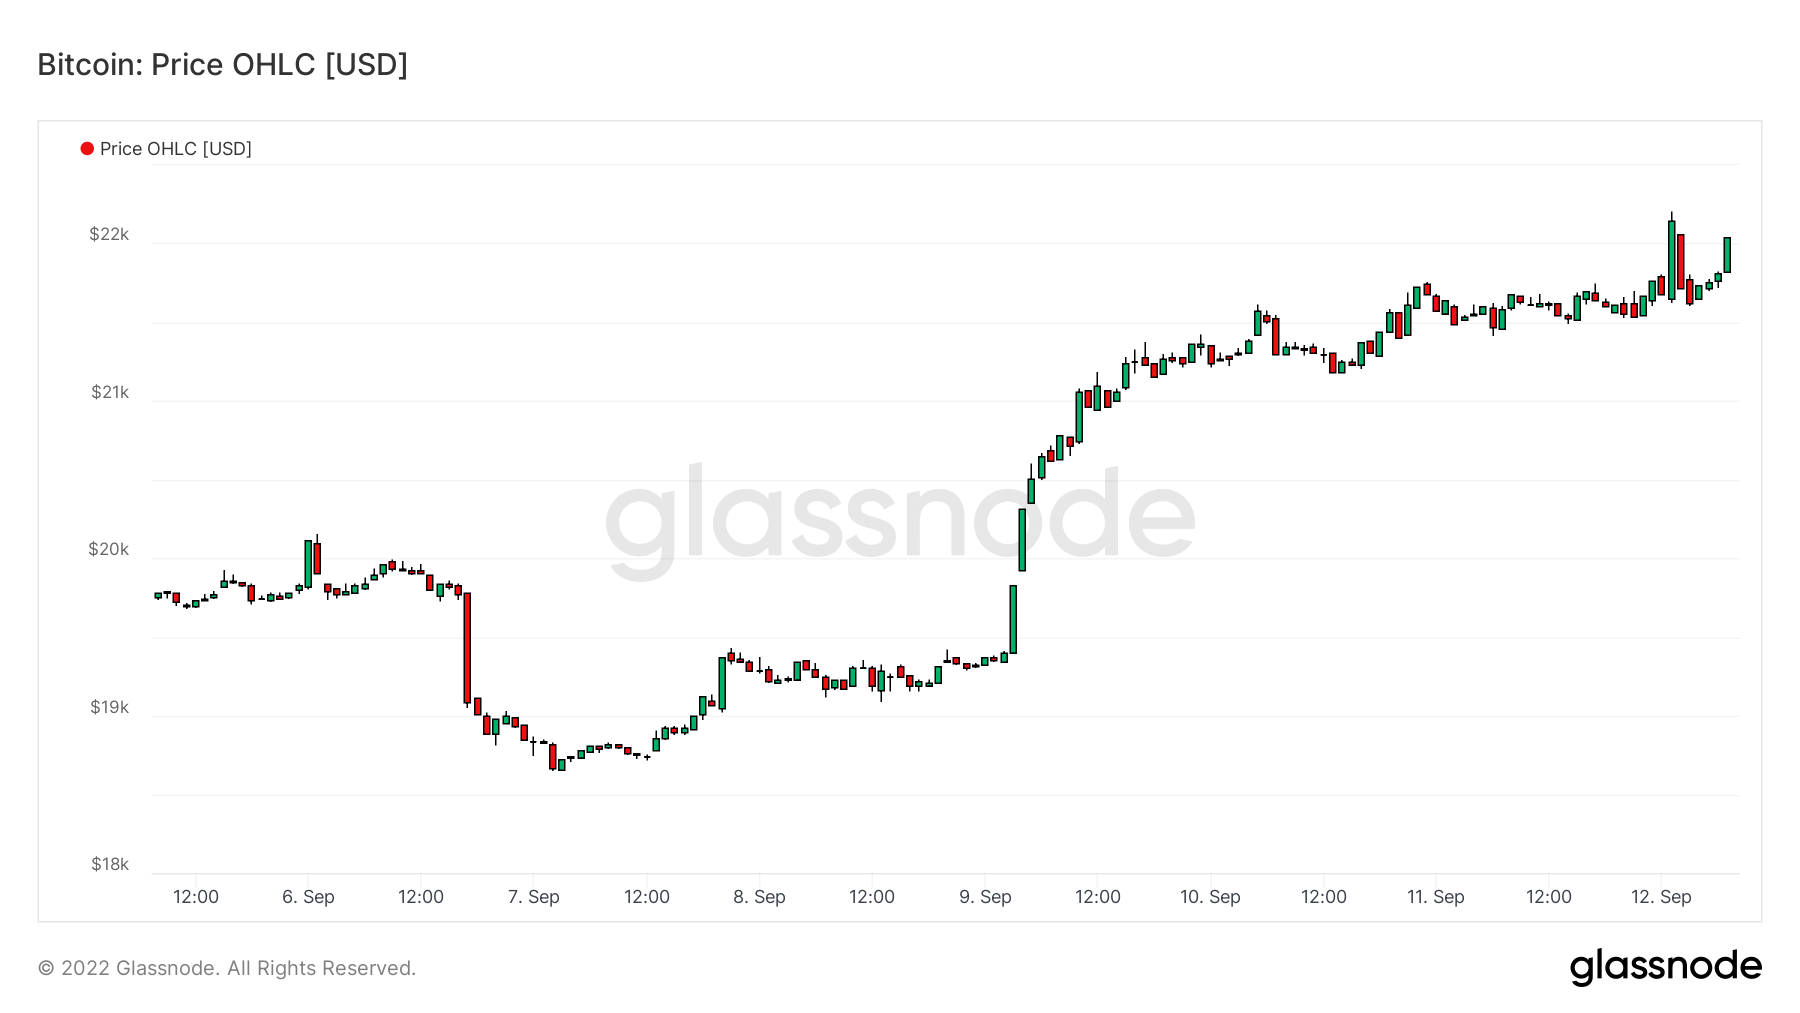
From Sept. 5 onwards, Bitcoin has been trading below the realized price which is $21,500
Russia is working with several friendly countries on cross-border settlements in stablecoins
Beijing-based mining pool Poolin has suspended withdrawals from its wallet citing liquidity issues. Currently, 10% of the bitcoin hash rate points to the Poolin mining pool.
On Sep. 8, the Climate and energy implications of crypto-assets in the U.S. got released by the white house
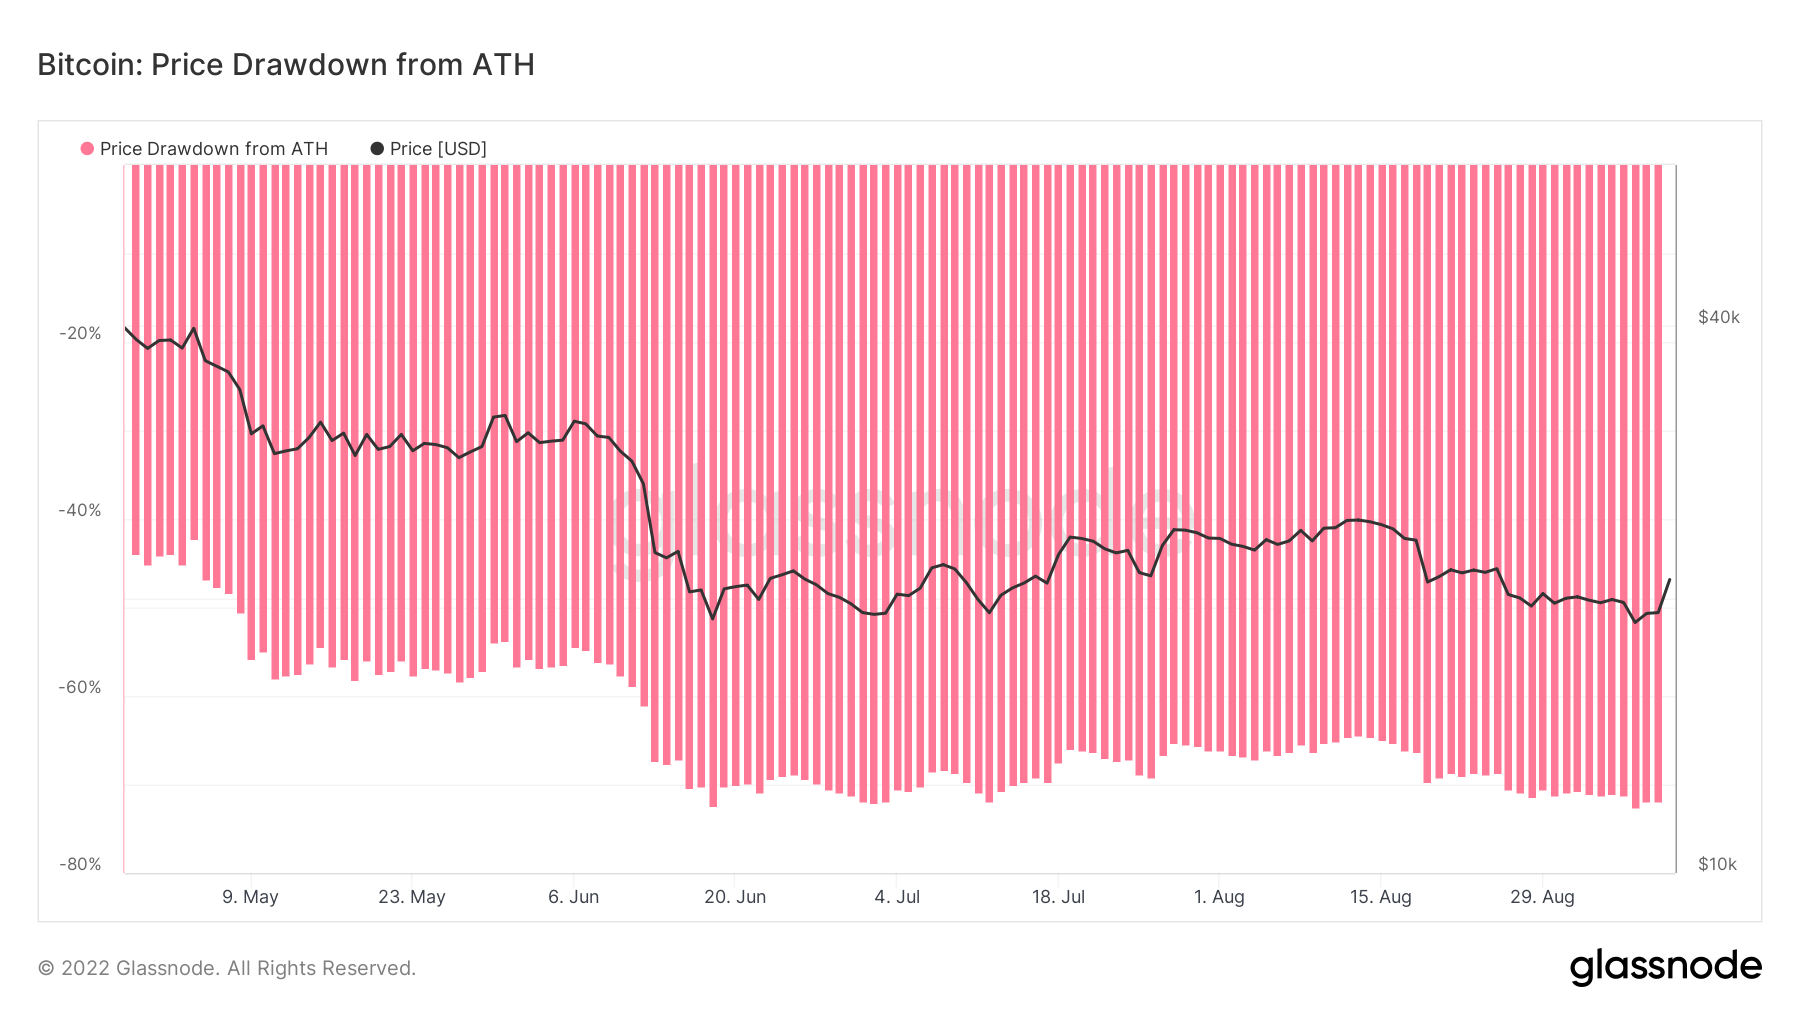
Bitcoin closed Sept. 6 at $18,849 down 72.6% drop from its all-time high and the lowest close of a day in 2022
Adressen
Sammlung vun Kär Adress Metriken fir de Reseau.
D'Zuel vun eenzegaartegen Adressen déi am Netz aktiv waren entweder als Sender oder Empfänger. Nëmmen Adressen déi aktiv waren an erfollegräichen Transaktioune ginn gezielt. Aktiv Adressen 934,803 0.64% (7 D)
D'Zuel vun eenzegaartegen Adressen déi fir d'éischte Kéier an enger Transaktioun vun der gebierteg Mënz am Netz erschéngen. Nei Adressen 2,868,464 3.28% (7 D)
D'Zuel vun eenzegaarteg Adressen Holding 1 BTC oder manner. Adressen mat ≥ 1 BTC 901,681 0.18% (7 D)
D'Zuel vun eenzegaarteg Adressen Holding op d'mannst 1k BTC. Adressen mat Gläichgewiicht ≤ 1k BTC 2,140 -0.28% (7 D)
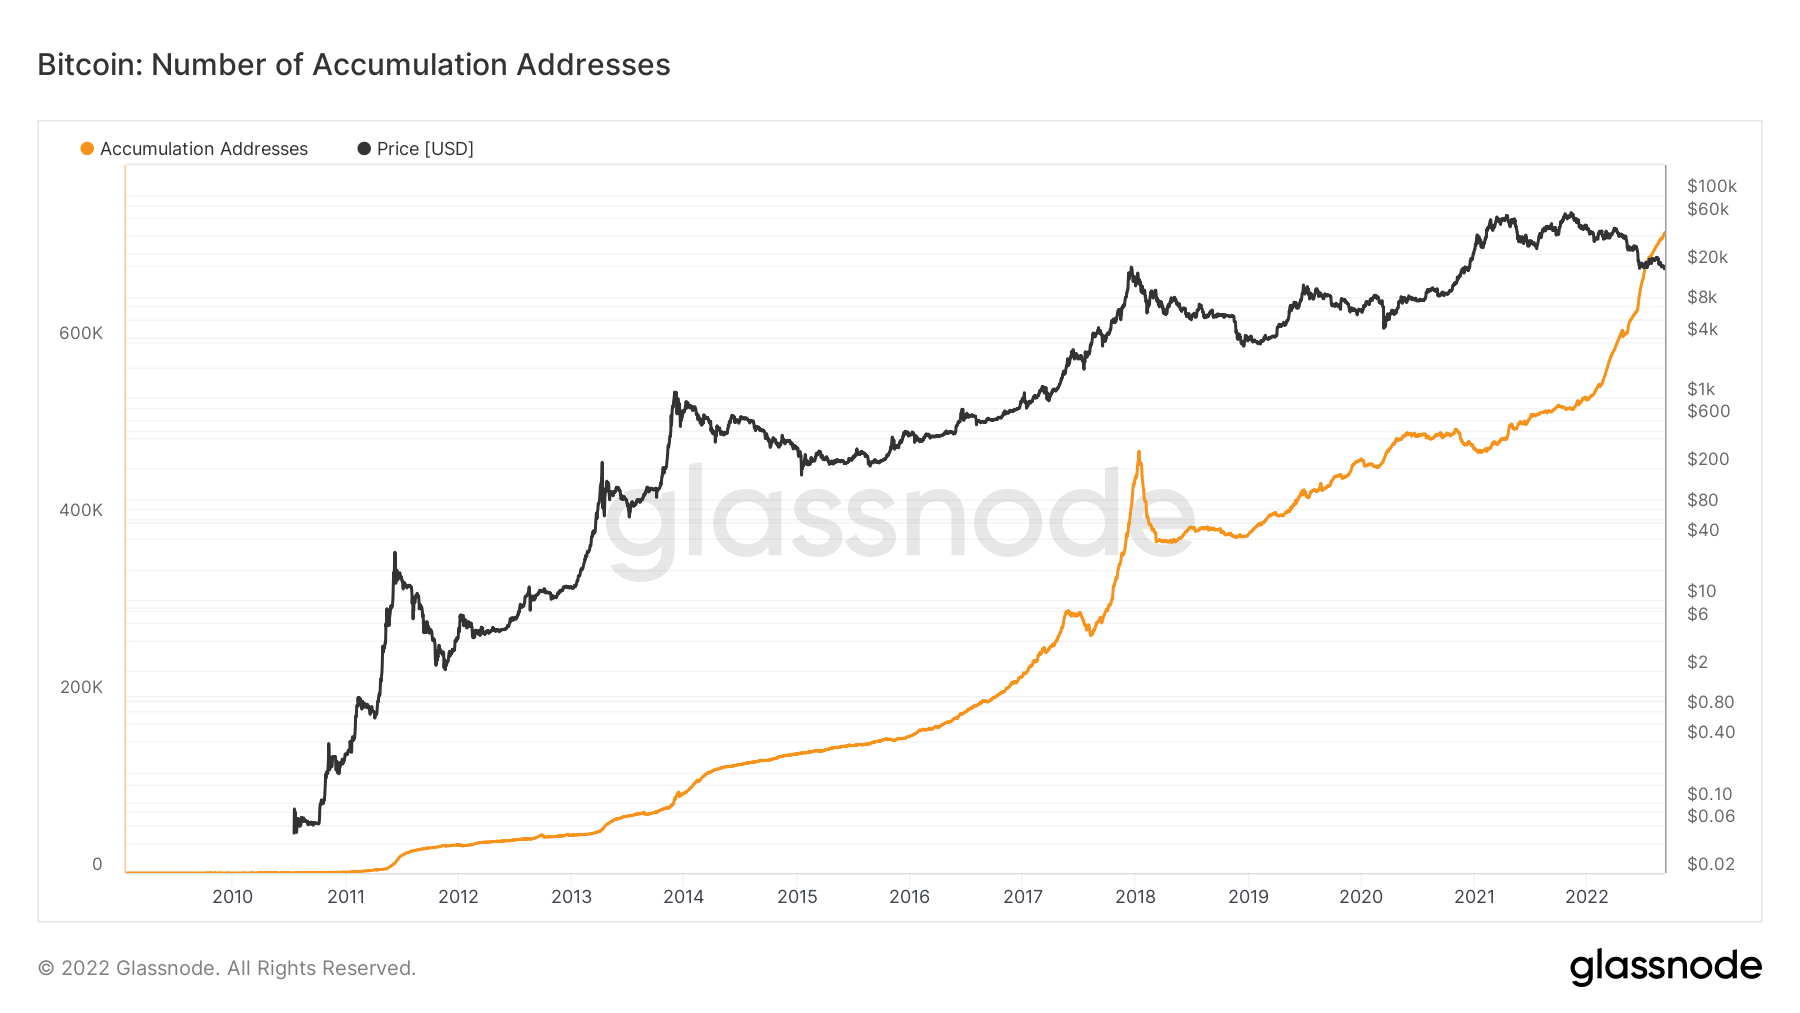
Accumulation addresses continue its vertical trajectory
The number of unique accumulation addresses continues to reach all-time highs. Accumulation addresses are addresses with at least 2 incoming non-dust transfers and never spent funds. Exchange addresses and addresses received from Coinbase transactions (miner addresses) are discarded. To account for lost coins, addresses that were last active more than 7 years ago are omitted as well.
During the 2017 bull run, accumulation addresses went parabolic, with an increase of over 200,000 addresses. However, a similar trend is occurring for 2022, with an increase of 200,000 addresses. But, the price has regressed since the start of the year. Addresses continue accumulating BTC through severe macro uncertainty and a lot of negative price action, but what is encouraging to see that many different cohorts are accumulating albeit at different levels. This year, a lot of selling has occurred mainly from liquidations and capitulation from short-term holders, which will be explained later in the newsletter.
Entitéiten
Entity-adjustéiert Metriken benotzen propriétaire Clustering Algorithmen fir eng méi präzis Schätzung vun der aktueller Zuel vun de Benotzer am Netz ze bidden an hir Aktivitéit ze moossen.
D'Zuel vun eenzegaartegen Entitéiten déi aktiv waren entweder als Sender oder Empfänger. Entitéite ginn definéiert als e Stärekoup vun Adressen déi vun der selwechter Netzwierkentitéit kontrolléiert ginn a geschat ginn duerch fortgeschratt Heuristik a Glassnode propriétaire Clustering Algorithmen. Aktiv Entitéiten 253,203 5.23% (7 D)
D'Zuel vun BTC an der Purpose Bitcoin ETF. Zweck ETF Holdings 23,679 -0.37% (7 D)
D'Zuel vun eenzegaartegen Entitéiten déi op d'mannst 1k BTC halen. Zuel vun Walen 1,700 -0.64% (7 D)
De Gesamtbetrag vun BTC ofgehalen op OTC Desk Adressen. OTC Desk Holdings 4,119 BTC 8.80% (7 D)
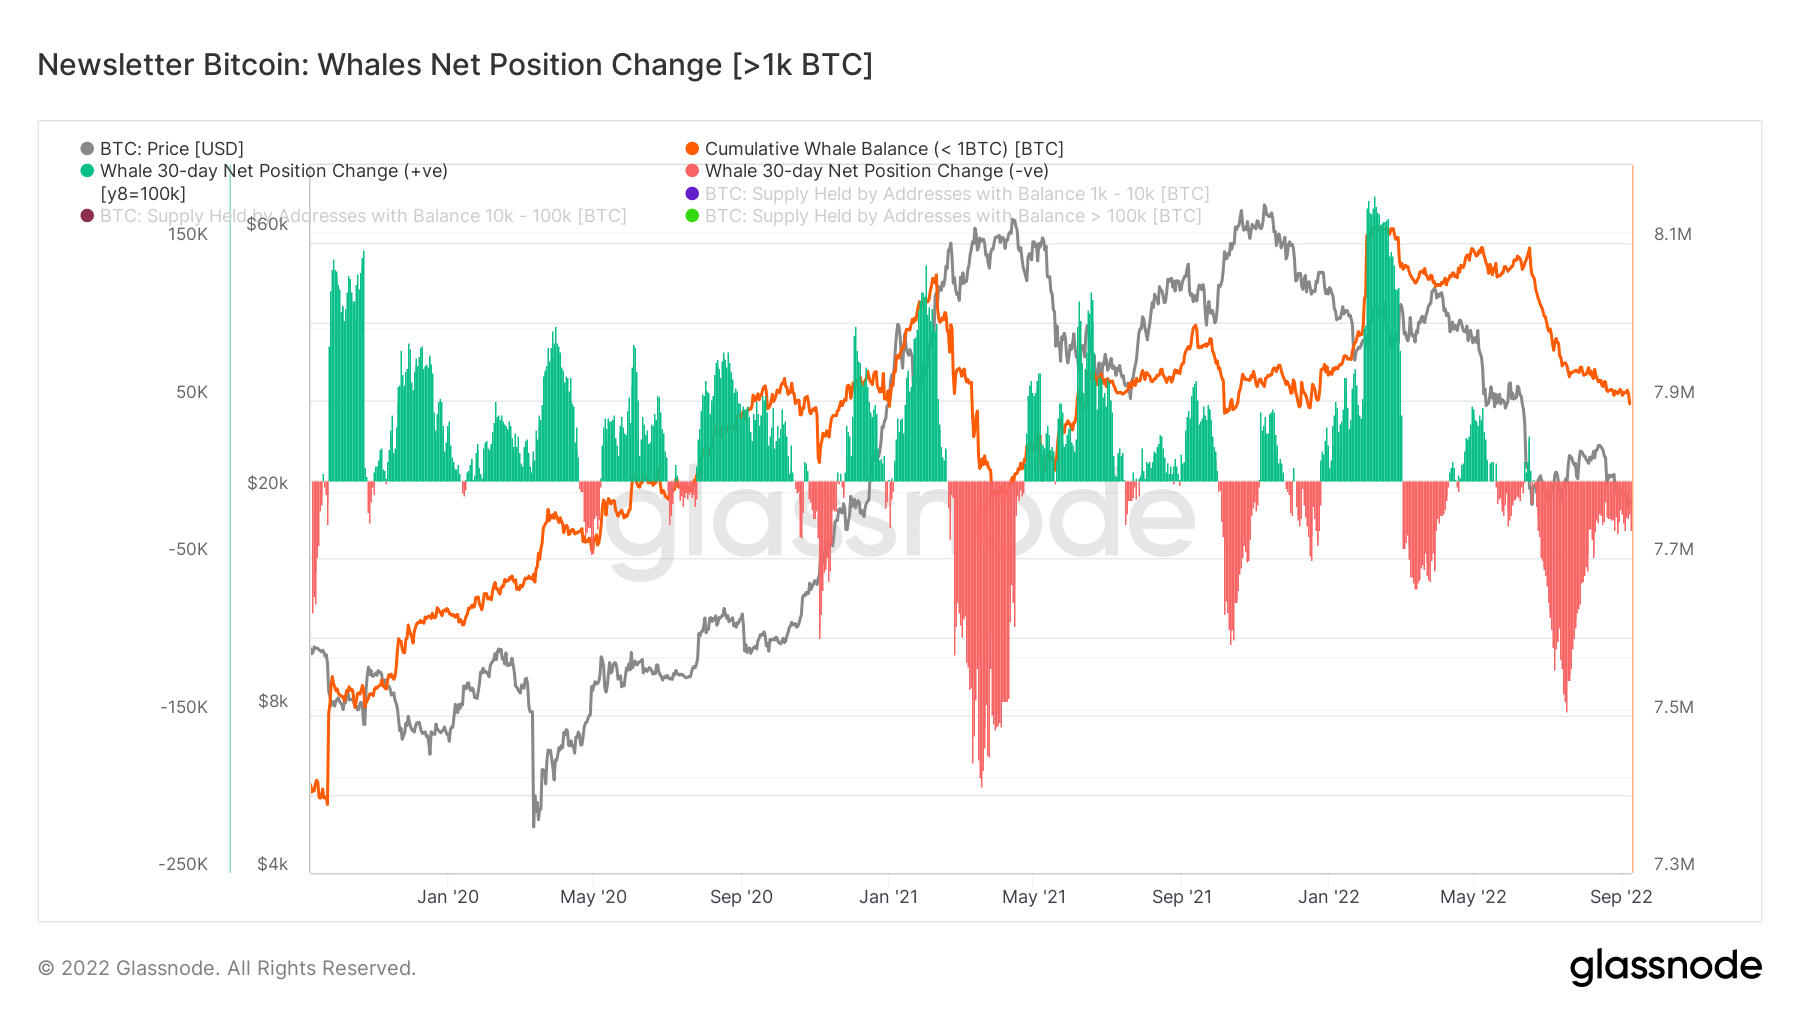
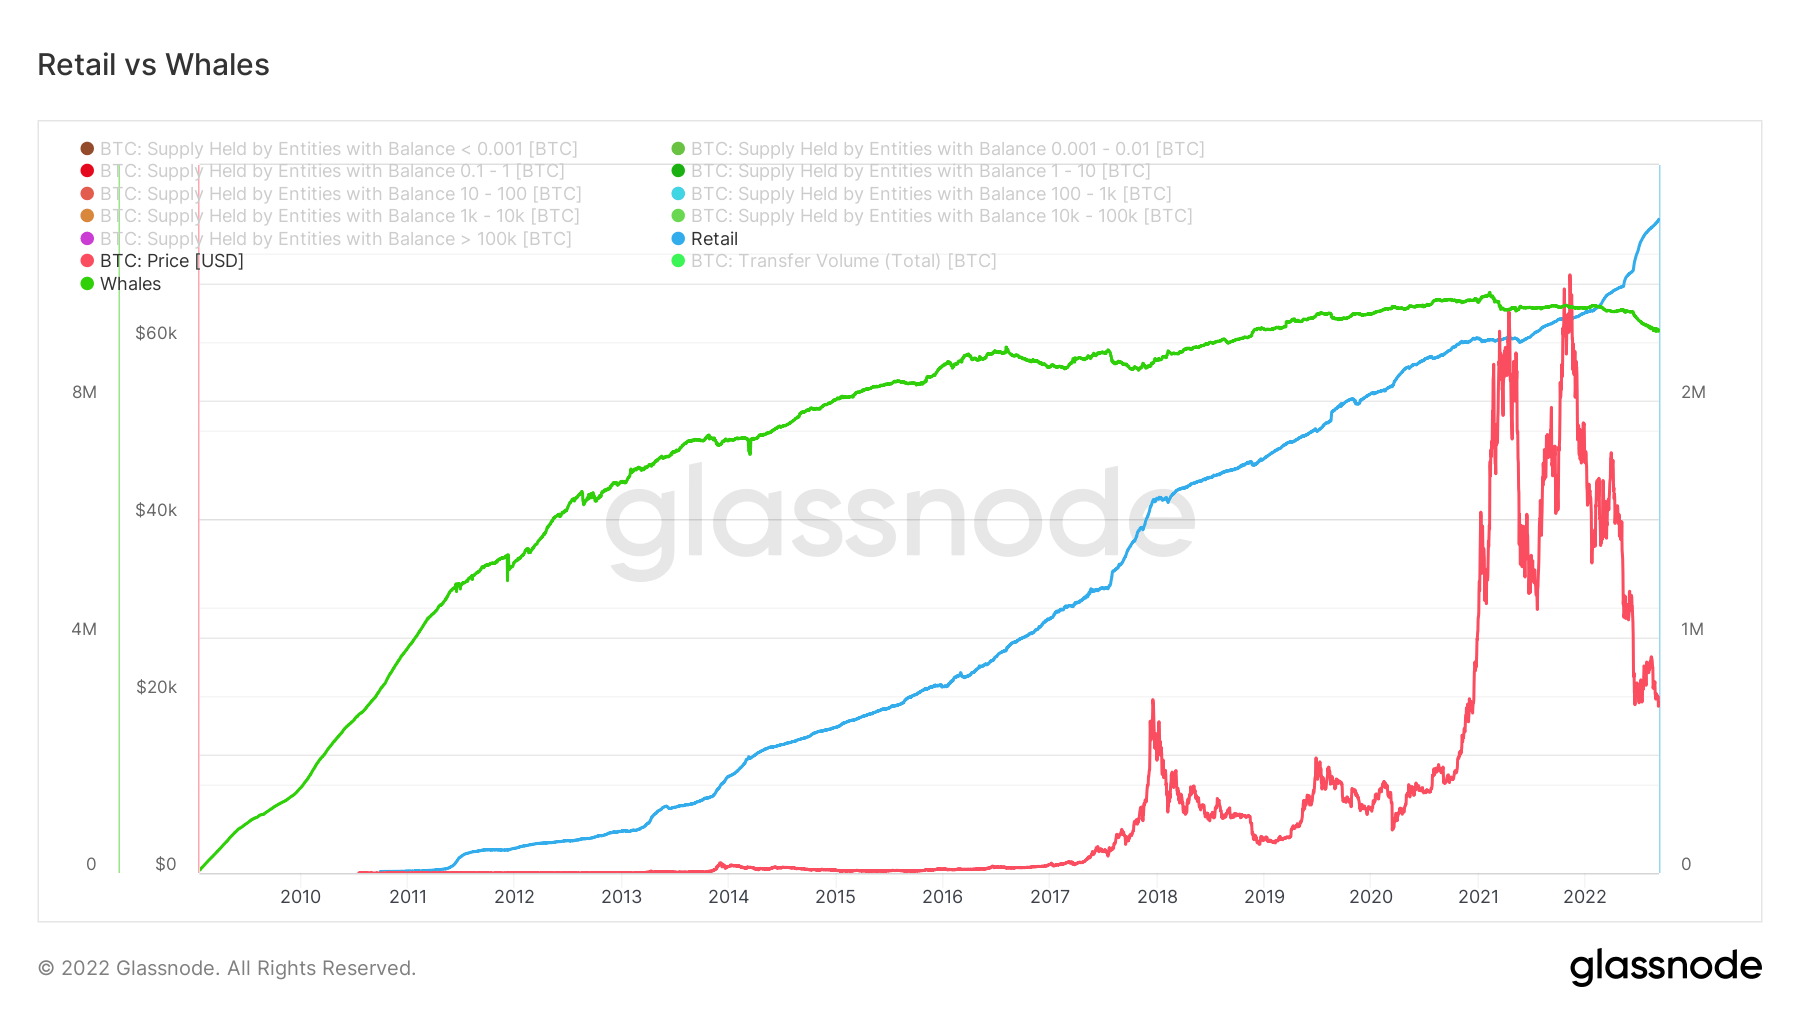
Whales continue to sell, while retail accumulates
Whales are defined by glassnode as an entity that holds 1,000 BTC or more. The graph below depicts the net position change of whales — when whales buy and sell. You can see when whales sold (red) in May 2021 and May 2022, the price dropped significantly. Conversely, when whales purchase BTC, it also has a significant relationship with price appreciation. However, much of 2022 has seen whales distribute heavily, most notably after the Terra Luna collapse.
As whales continue to sell their BTC holdings, retail is one of the main entities continuing to accumulate. Retail holds almost 3 million BTC compared to whales’ 9 million BTC. However, we can see a clear trend of exponential growth of retail holdings, which is a net positive for the adoption and distribution of BTC as it’s concentrated in fewer hands which is one of the many criticisms of Bitcoin.
Dervativ
En Derivat ass e Kontrakt tëscht zwou Parteien, dee säi Wäert / Präis vun engem ënnerierdesche Verméigen ofleet. Déi heefegst Aarte vun Derivate sinn Futures, Optiounen a Swaps. Et ass e finanziellt Instrument dat säi Wäert / Präis aus dem ënnerierdesche Verméigen ofgeleet.
De Gesamtbetrag vun de Fongen (USD Value) zougewisen an oppe Futures Kontrakter. Futures Open Interessi $ 12.56B 9.36% (7 D)
De Gesamtvolumen (USD Value) gehandelt an Futures Kontrakter an de leschten 24 Stonnen. Futures Volumen $ 21.8B $23.49 (7 D)
D'Zomm liquidéiert Volumen (USD Value) vu Kuerzpositiounen an Futures Kontrakter. Total Long Liquidatiounen $ 129.34M $ 65.39M (7 D)
D'Zomm liquidéiert Volumen (USD Wäert) vu laange Positiounen an Futures Kontrakter. Total Short Liquidatiounen $ 112.77M $ 75.77M (7 D)
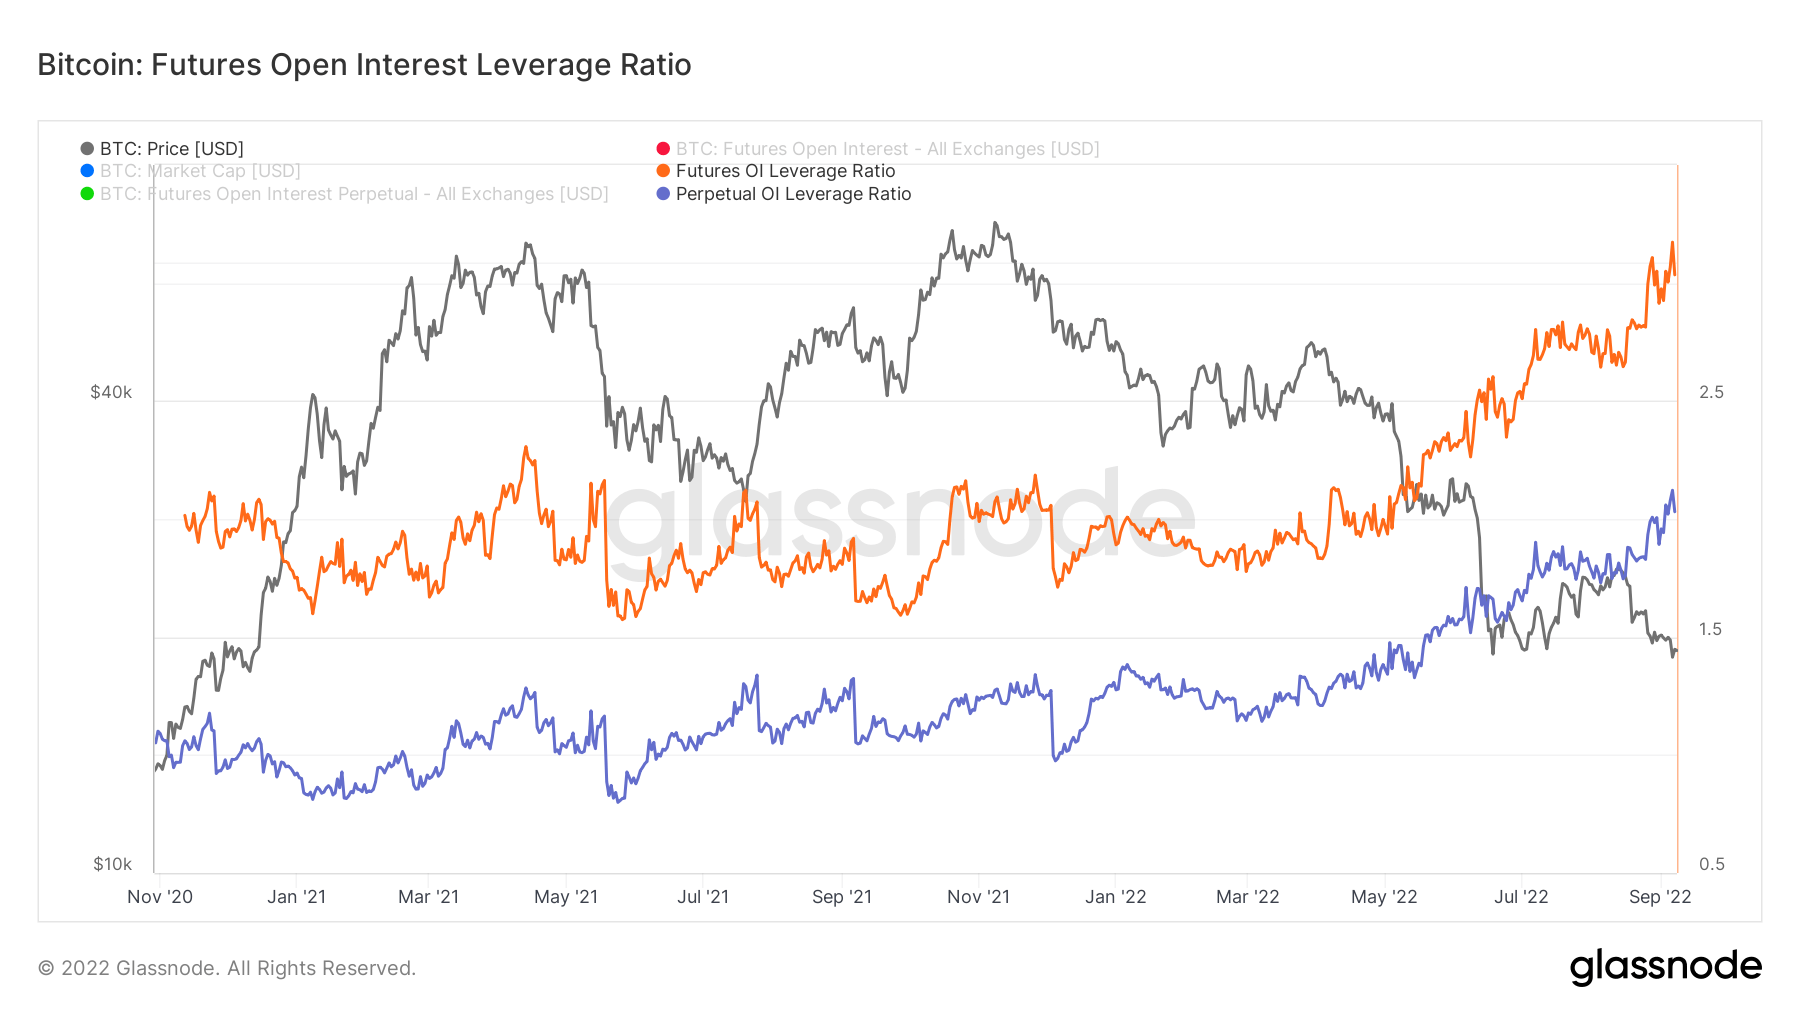
The all-time high for futures and perpetual open interest – brace for volatility
The Futures Open Interest Leverage Ratio is calculated by dividing the market open contract value by the asset’s market cap (presented as %). This returns an estimate of the degree of leverage that exists relative to market size as a gauge for whether derivatives markets are a source of deleveraging risk.
- High Values indicate that futures market open interest is large relative to the market size. This increases the risk of a short/long squeeze, deleveraging event, or liquidation cascade.
- Low Values indicate that futures market open interest is small relative to the market size. This is generally coincident with a lower risk of derivative-led forced buying/selling and volatility.
- Deleveraging Events such as short/long squeezes or liquidation cascades can be identified by rapid declines in OI relative to market cap and vertical drops in the metric.
Currently, both futures and perpetual OI are at all-time highs, which increases the chances of a more volatile market, as we’ve seen over the past few weeks of an increasing amount of liquidations and deleveraging events.
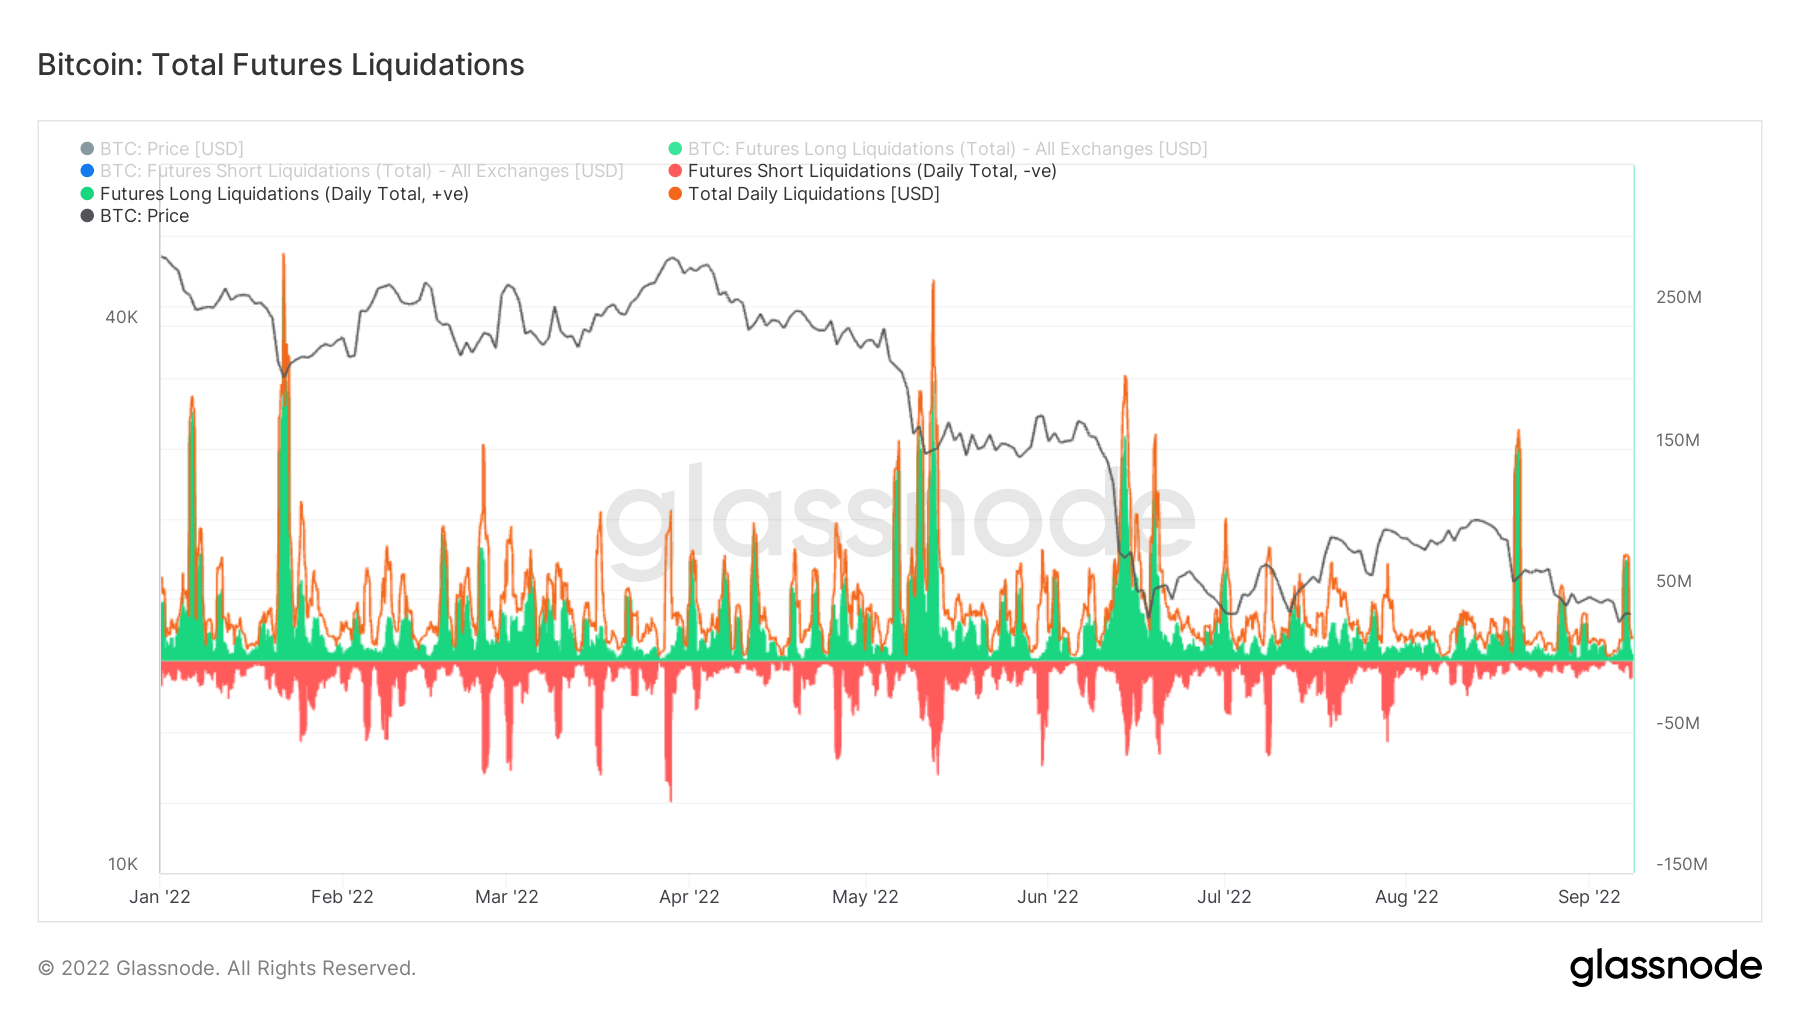
Over $300m of longs liquidated
As leverage increases in the ecosystem, so does the probability of liquidation. This is supported by the metric Total Futures Liquidations, which has seen a considerable amount of liquidations in recent weeks, on Sep. 7th we saw around $70m of longs liquidated, plus $145m of longs liquidated on Aug 19th. Two of the most amount of longs liquidated this year as investors were trying to buy the bear market rally.
Miner
Iwwersiicht vun wesentleche Miner Metriken am Zesummenhang mat Hashing Kraaft, Einnahmen, a Blockproduktioun.
Déi duerchschnëttlech geschätzte Zuel vun Hashes pro Sekonn produzéiert vun de Miner am Netz. Hash Taux 282 TH / s 8.05% (7 D)
D'total Versuergung ofgehalen an Miner Adressen. Miner Gläichgewiicht 1,834,866 BTC 0.05% (7 D)
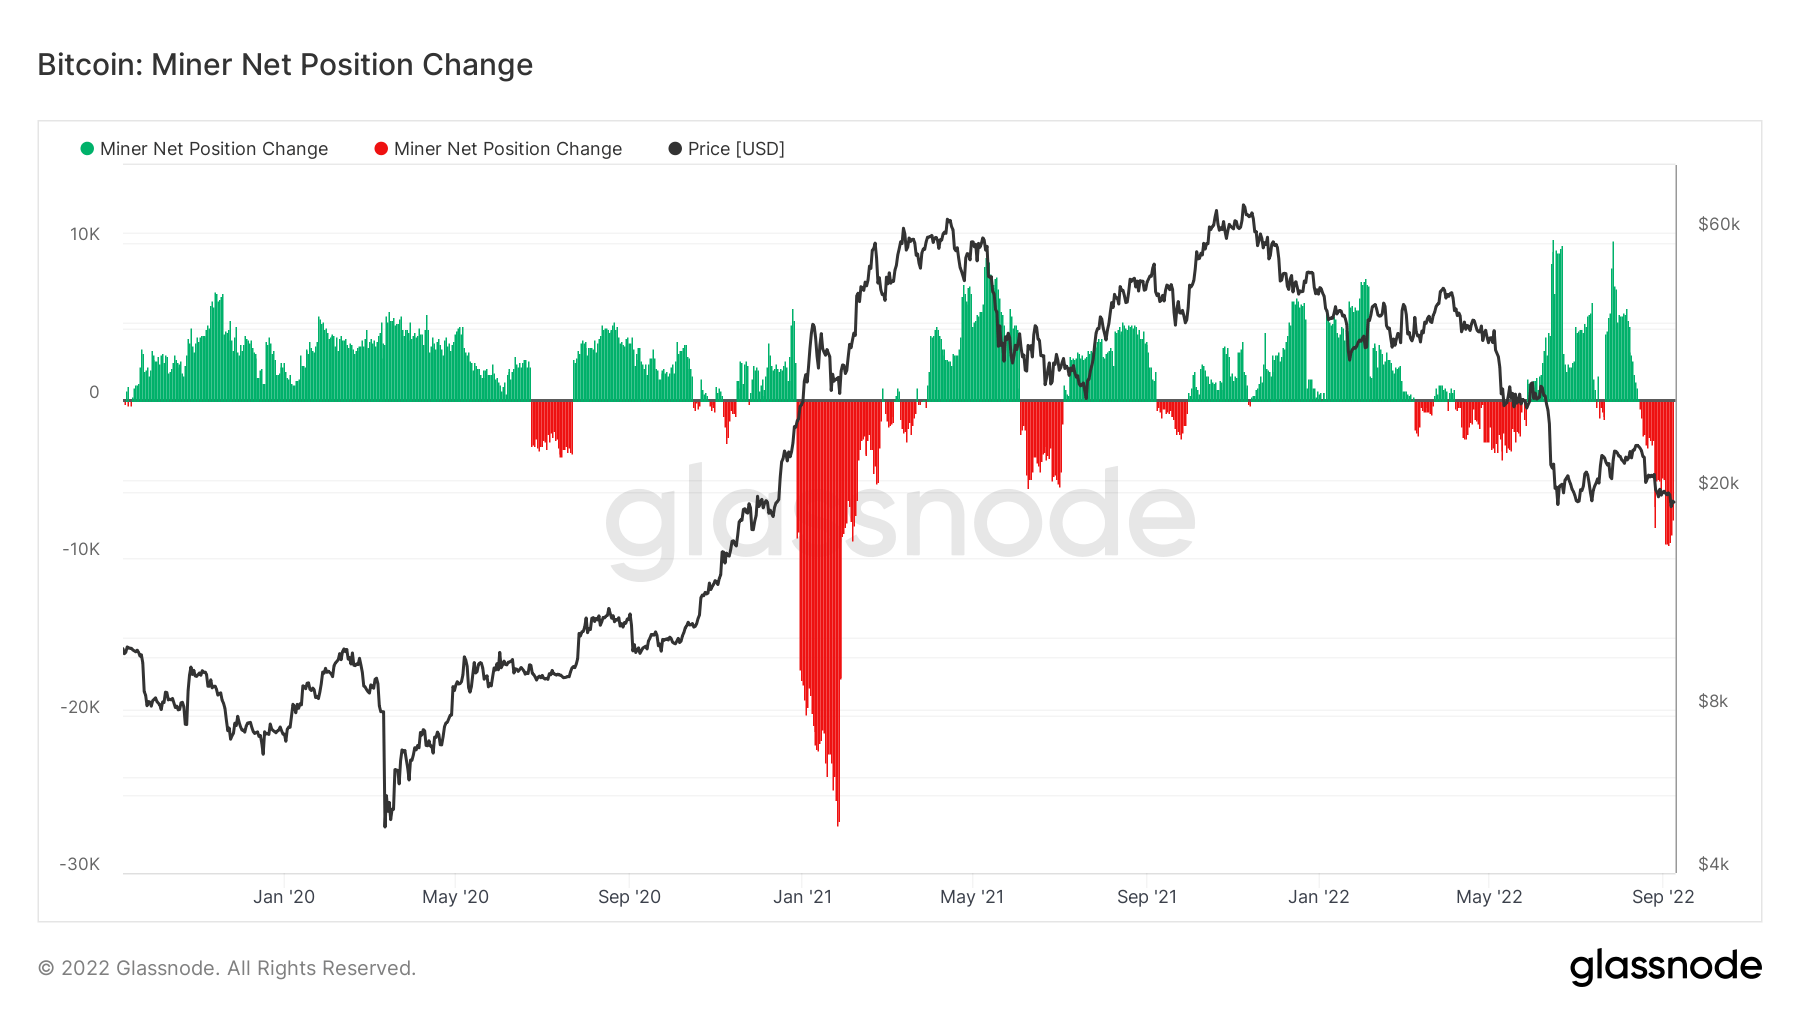
De Gesamtbetrag vun de Mënzen, déi vu Miner transferéiert goufen fir Portemonnaien auszetauschen. Nëmmen direkt Transfere ginn gezielt. Miner Net Positioun änneren -51,751 BTC -4,170 BTC (7 D)
Miner capitulation isn’t over
Due to rising production costs and a mining difficulty of 1% off its all-time high we are witnessing revenues fall for miners which will see unprofitable miners switch off from the network. The hash ribbon metric is currently signalling mining capitulation is over however, Cryptoslate aren’t believing this at the moment.
With this extensive financial pressure on miners, outflows have reached peaks of almost 10,000 BTC, which is comparable with the 2018/19 bear market but not as significant as the early 2021 selling. Balance in miner wallets continues to sell off from its peak (around 15,000 BTC), however, once CryptoSlate see a meaningful reversal in miner behaviour we can become more bullish on a BTC bottom forming.
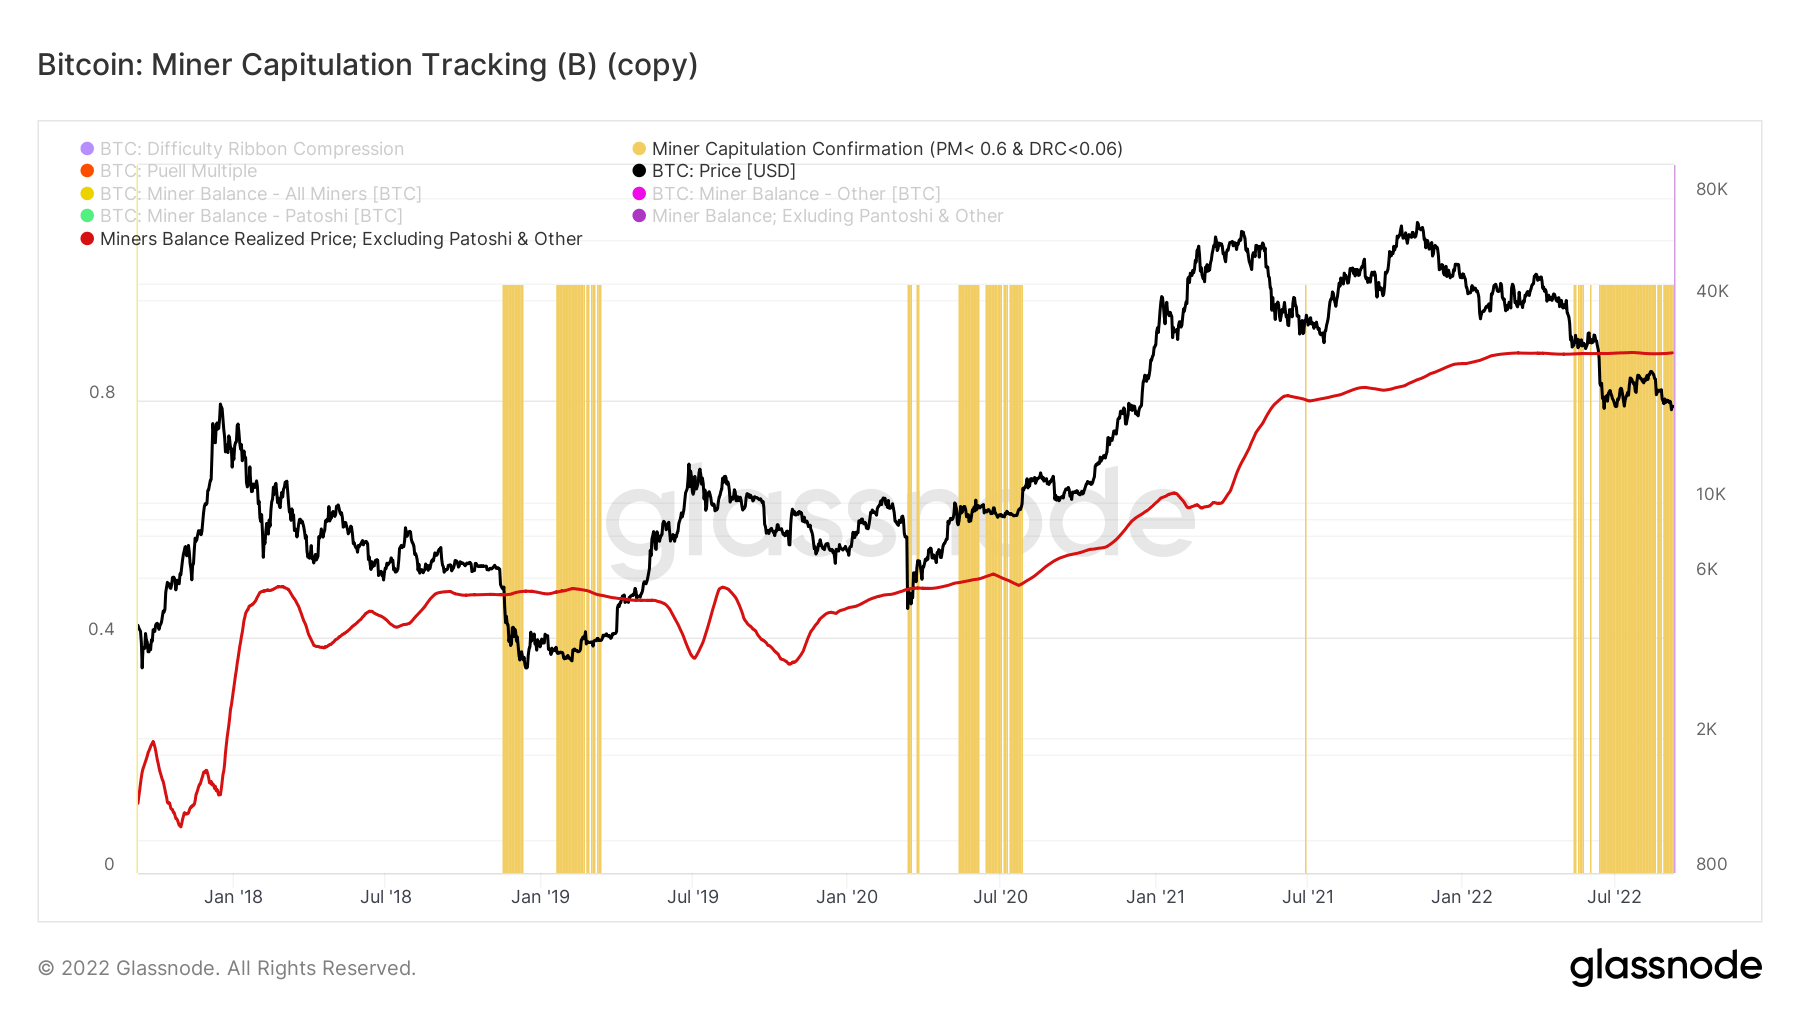
To confirm the capitulation from the miners isn’t over. The miner capitulation tracking tool assesses the probability of a capitulation within miners, whilst it seeks a confluence between a Pull Multiple < 0.6 and difficulty ribbon compression <0.06. as well as taking the realized price for miners (excluding patoshi coins) which acts as a gauge for the mined balance cost basis, currently stands at $ 27,775.
Where CryptoSlate has highlighted zones in yellow shows capitulation where Bitcoin has traded below the realized price for miners. As you can see for much of the second half of 2022, we have been trading below the realized price, this tracing tool also confirmed capitulation during 2014-15, 2018-2019, and the 2020 bear market.
On-Chain Aktivitéit
Sammlung vun On-Chain Metriken am Zesummenhang mat zentraliséierter Austauschaktivitéit.
De Gesamtbetrag vun de Mënzen déi op Austauschadressen ofgehale ginn. Exchange Gläichgewiicht 2,371,982 BTC 27,173 BTC (7 D)
Déi 30 Deeg Ännerung vun der Versuergung ofgehalen an Austausch Portemonnaien. Exchange Net Position Change -117,735 BTC 262,089 BTC (30 D)
De Gesamtbetrag vun de Mënzen, déi vun den Austauschadressen transferéiert goufen. Volumen vum Handel 247,259 BTC 12 BTC (7 D)
De Gesamtbetrag vun de Mënzen op Austauschadressen transferéiert. De Volume vun de Bäitrëttshandels 257,063 BTC 5 BTC (7 D)
The number of transactions signifies a bear market
The number of transactions sheds further insight into the demand for network utilization and block space. Limited available block space limits transactional capacity, and fees are used to generate a transaction. Low fees, no clear sign of traffic congestion.
During the bull runs of 2017 and 2021, it is clear to see a massive spike in the number of transactions, surpassing 300,000. However, as bull market cycles finish and bear markets begin, transactions start to fall off a cliff which is noticeable in 2018 and beginning to mid-2021. After a few months of recovery in 2021, demand has stagnated for the past twelve months, indicating this is a HODLers environment. This floor becomes the new normal until the next bull market resumes.
Geo Decompte
Regional Präisser ginn an engem zwee-Schrëtt Prozess konstruéiert: Éischtens, Präisbeweegunge ginn u Regiounen zougewisen baséiert op Aarbechtszäiten an den USA, Europa an Asien. Regional Präisser ginn dann festgeluecht andeems Dir déi kumulativ Zomm vun de Präisännerungen iwwer Zäit fir all Regioun berechnen.
Dës Metrik weist d'30-Deeg Ännerung vum regionale Präis festgeluecht während Asien Aarbechtszäiten, dh tëscht 8 an 8 China Standard Time (00:00-12:00 UTC). Asien 4,762 BTC -3,260 BTC (7 D)
Dës Metrik weist d'30-Deeg Ännerung vum regionale Präis, deen an der EU-Aarbechtszäit festgeluecht gouf, also tëscht 8 an 8 Zentraleuropäesch Zäit (07:00-19:00 UTC), respektiv Zentraleuropäesch Summerzäit (06:00-18:00 Auer) UTC). Europa -15,070 BTC -3,617 BTC (7 D)
Dës Metrik weist d'30-Deeg Ännerung vum regionale Präis, deen an den US-Aarbechtszäiten festgeluecht gouf, dh tëscht 8 an 8 Ostzäit (13:00-01:00 UTC), respektiv Eastern Daylight Time (12:00-0:00 UTC) . US -12,827 BTC 6,027 BTC (7 D)
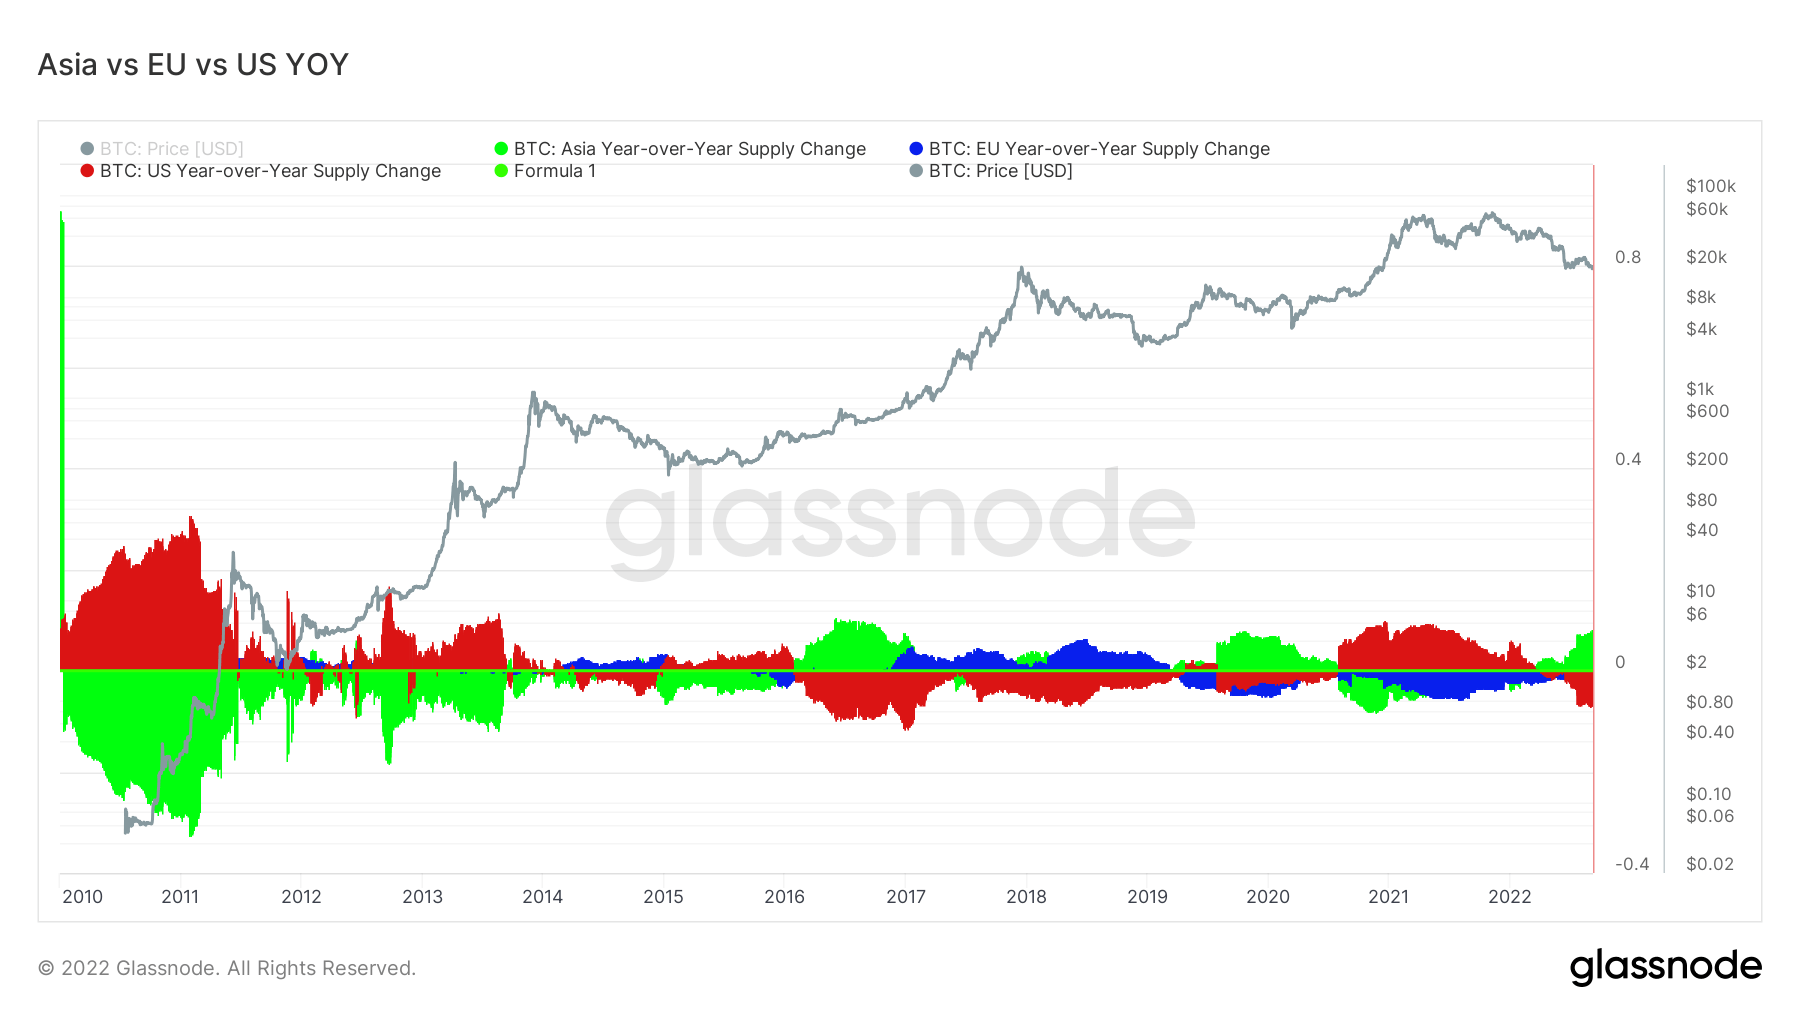
Asia extends bullishness
Asian investors, which are considered “smart money,” have continued to accumulate since the start of September. Meanwhile, fear continues to grow in the U.S. and EU.
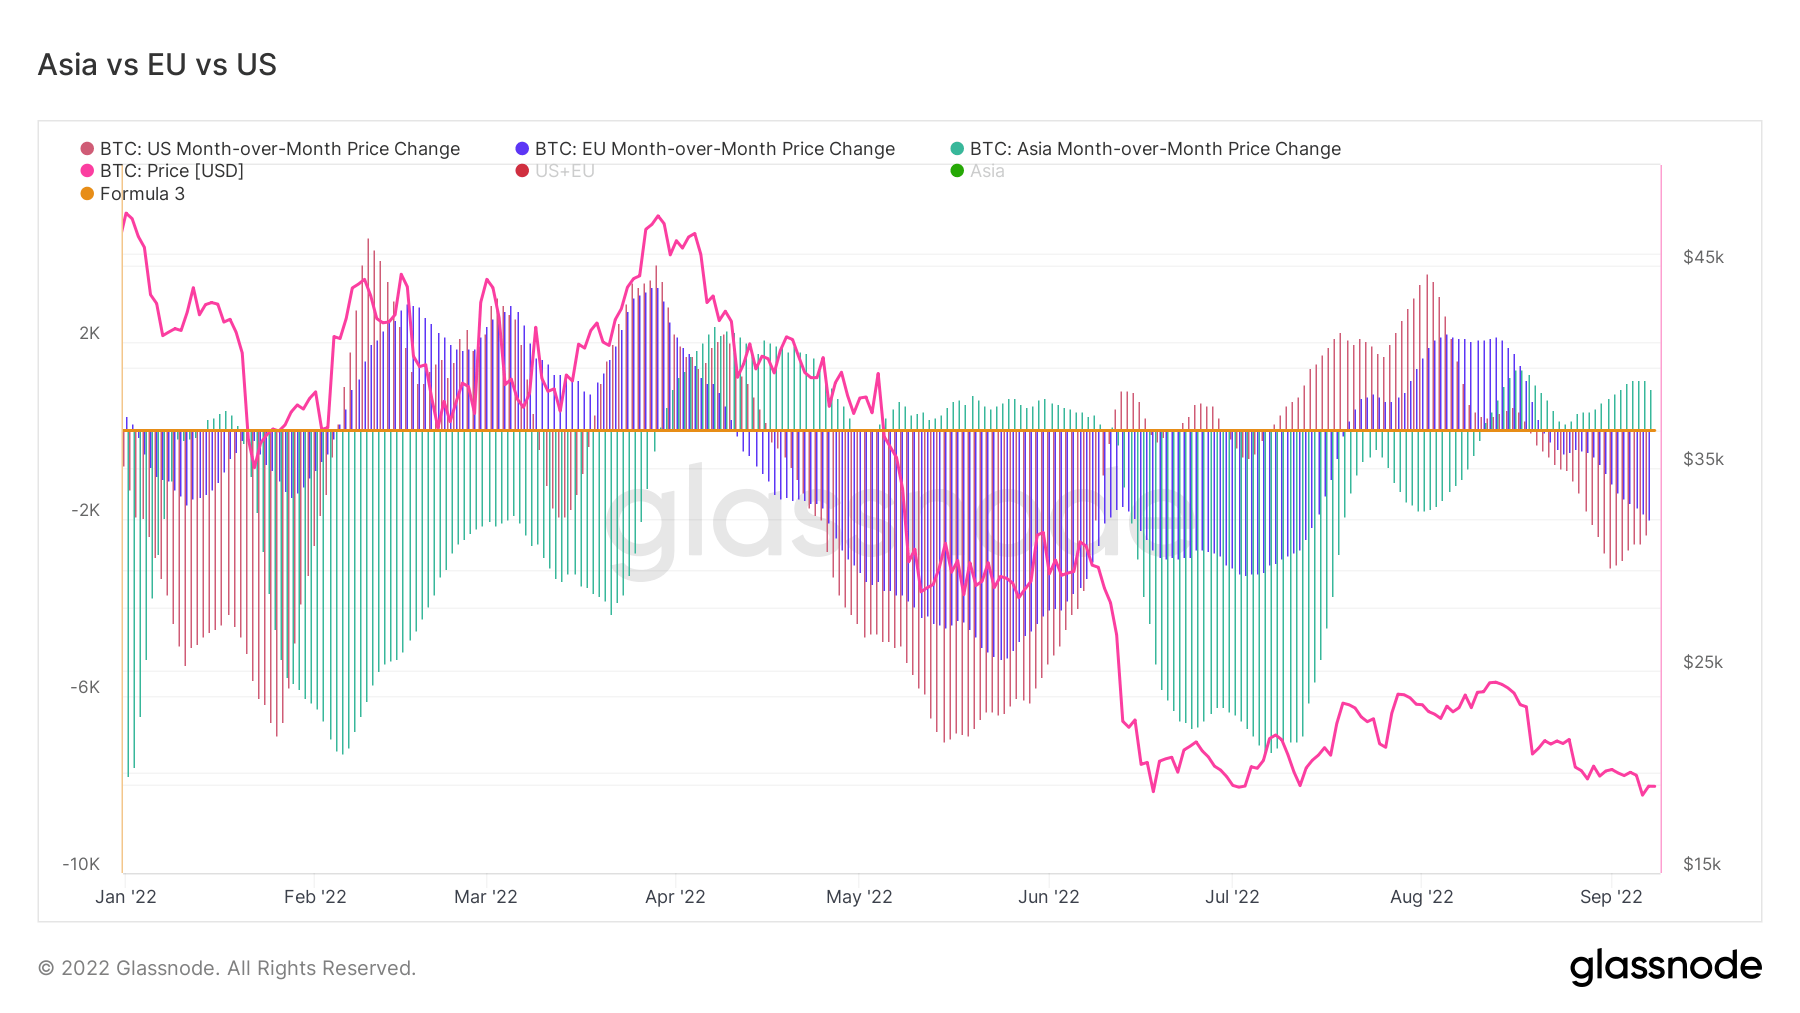
The year-over-year supply continues to extend with Asia, and their bullishness is currently in line with the 2016-17 and 2020 bear markets. Asia is picking up cheap BTC during macro uncertainty.
Layer-2
Secondary layers, such as the Lightning Network, exist on the Bitcoin blockchain and allows users to create payment channels where transactions can occur away from the main blockchain
The total amount of BTC locked in the Lightning Network. Blëtz Kapazitéit 4,749 BTC 1.41% (7 D)
The number of Lightning Network nodes. No. of Nodes 17,459 -0.11% (7 D)
The number of public Lightning Network channels. Nee Channels 85,528 -0.50% (7 D)
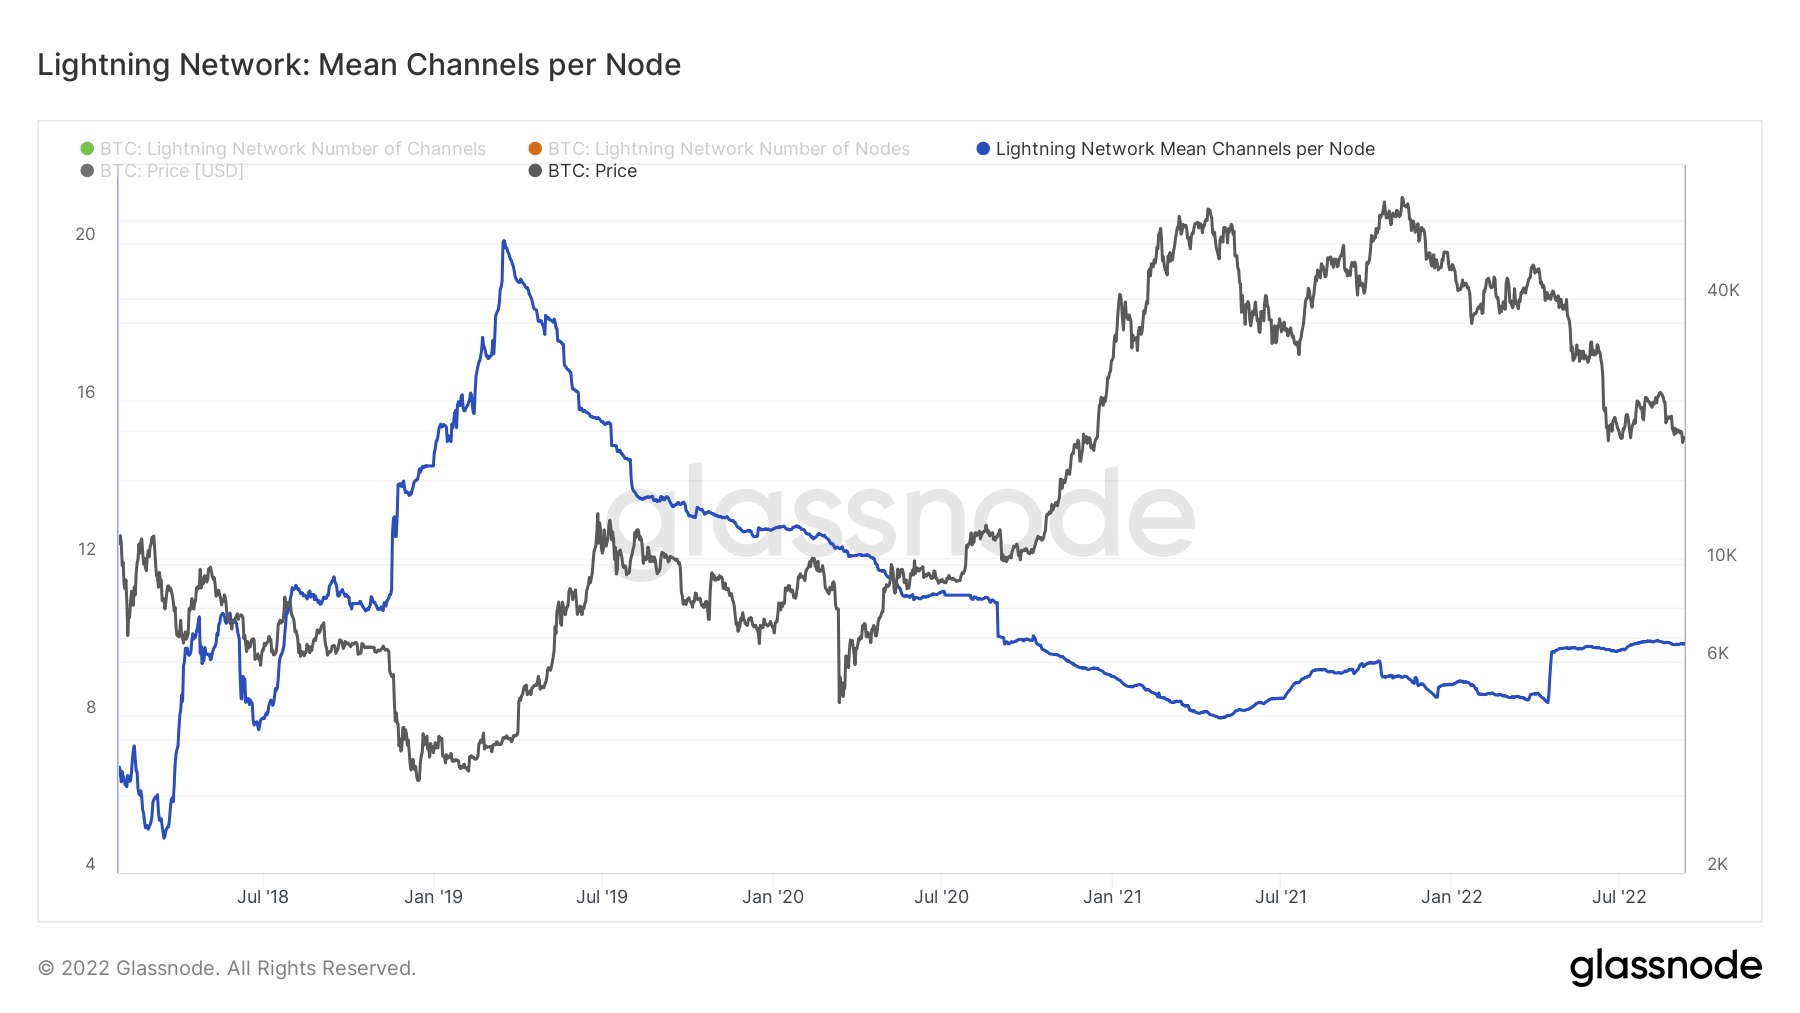
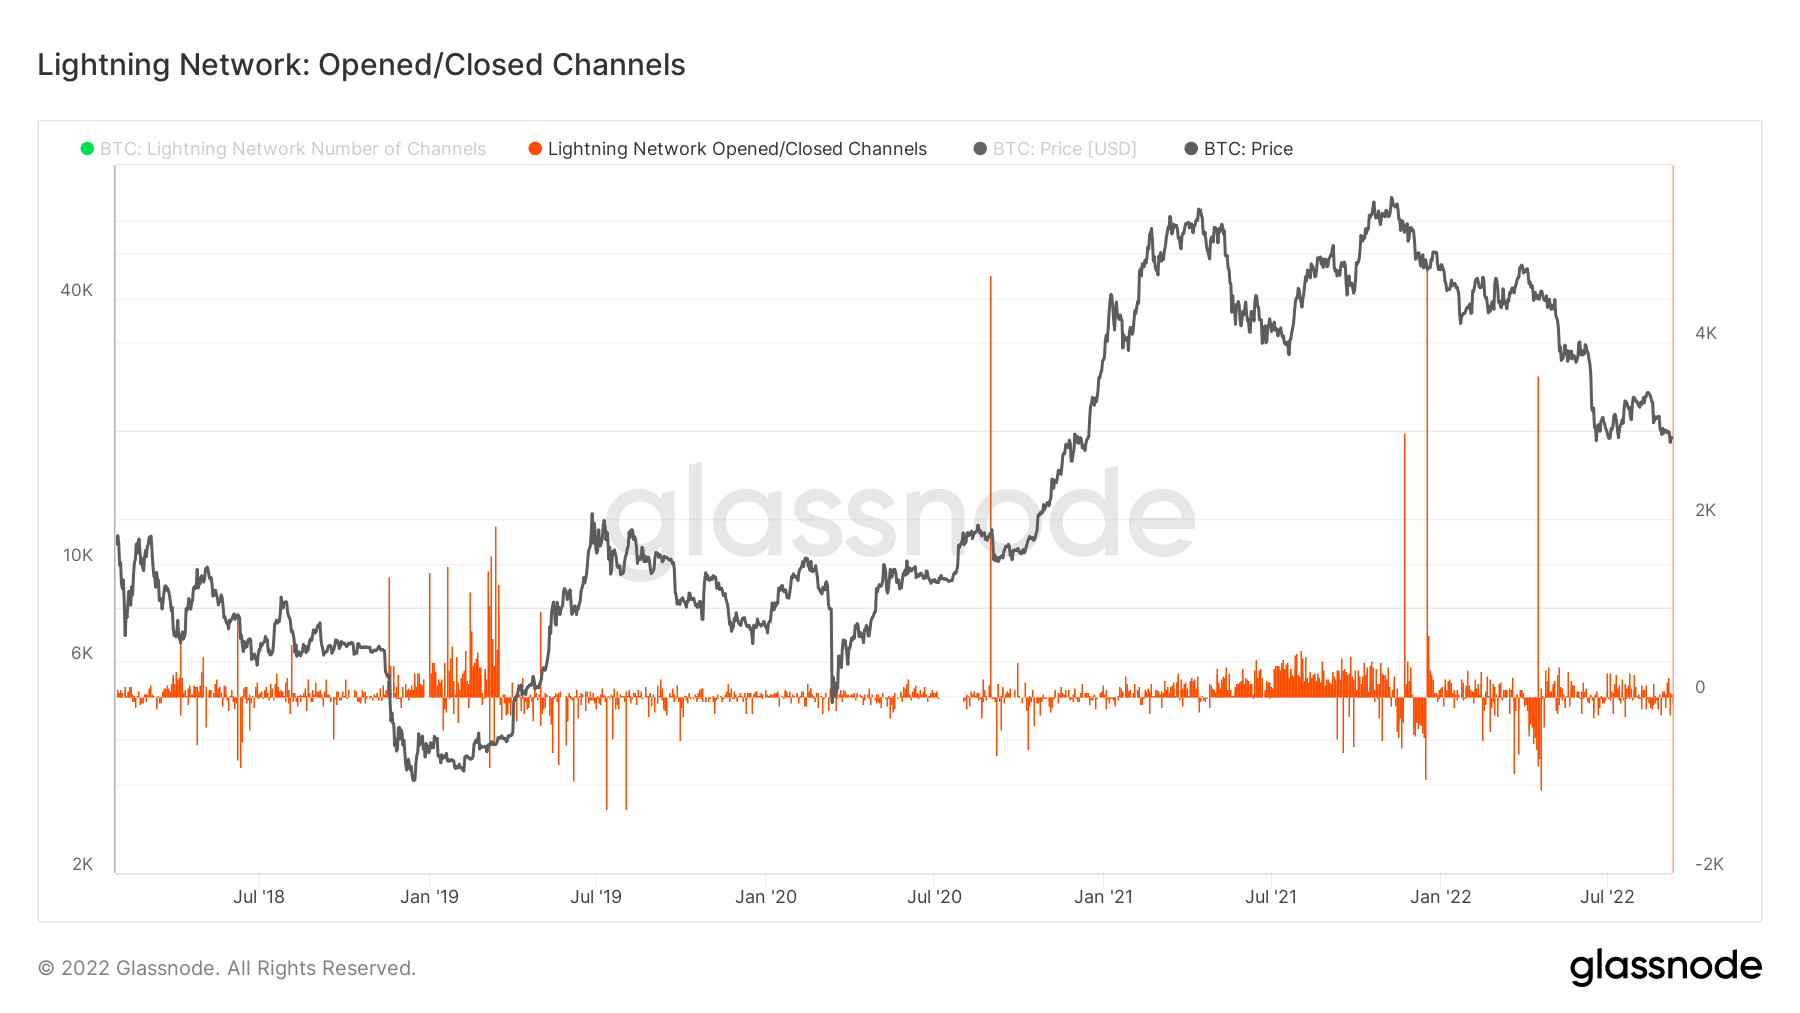
Lightning nodes and channels remain muted
As the lightning network continues to grow organically and continues to hit all-time highs week after week for August. From a node and channel perspective it remains muted, an average number of lightning network channels per node has remained flat for almost 2 years. Whilst lightning network channels opened or closed each day is considerably less compared to the bull market of 2021.
Supply
De Gesamtbetrag vun der zirkuléierender Versuergung déi vu verschiddene Kohorten gehal gëtt.
De Gesamtbetrag vun der zirkuléierender Versuergung déi vu laangfristeg Besëtzer gehal gëtt. Laangfristeg Holder Fourniture 13.61M BTC 0.29% (7 D)
De Gesamtbetrag vun der zirkuléierender Versuergung déi vu kuerzfristeg Besëtzer gehal gëtt. Kuerzfristeg Holder Fourniture 3.12M BTC -1.93% (7 D)
De Prozentsaz vun der zirkuléierender Versuergung déi net an op d'mannst 1 Joer geplënnert ass. Fourniture Last Active 1+ Joer ago 66% 0.00% (7 D)
D'Gesamtversuergung vun illiquid Entitéiten. D'Liquiditéit vun enger Entitéit ass definéiert als de Verhältnis vu kumulativen Ausfluss a kumulativen Inflows iwwer d'Liewensdauer vun der Entitéit. Eng Entitéit gëtt als illiquid / flësseg / héich flësseg ugesinn wann hir Liquiditéit L ≲ 0.25 / 0.25 ≲ L ≲ 0.75 / 0.75 ≲ L respektiv ass. Illiquid Versuergung 14.83M BTC 0.14% (7 D)
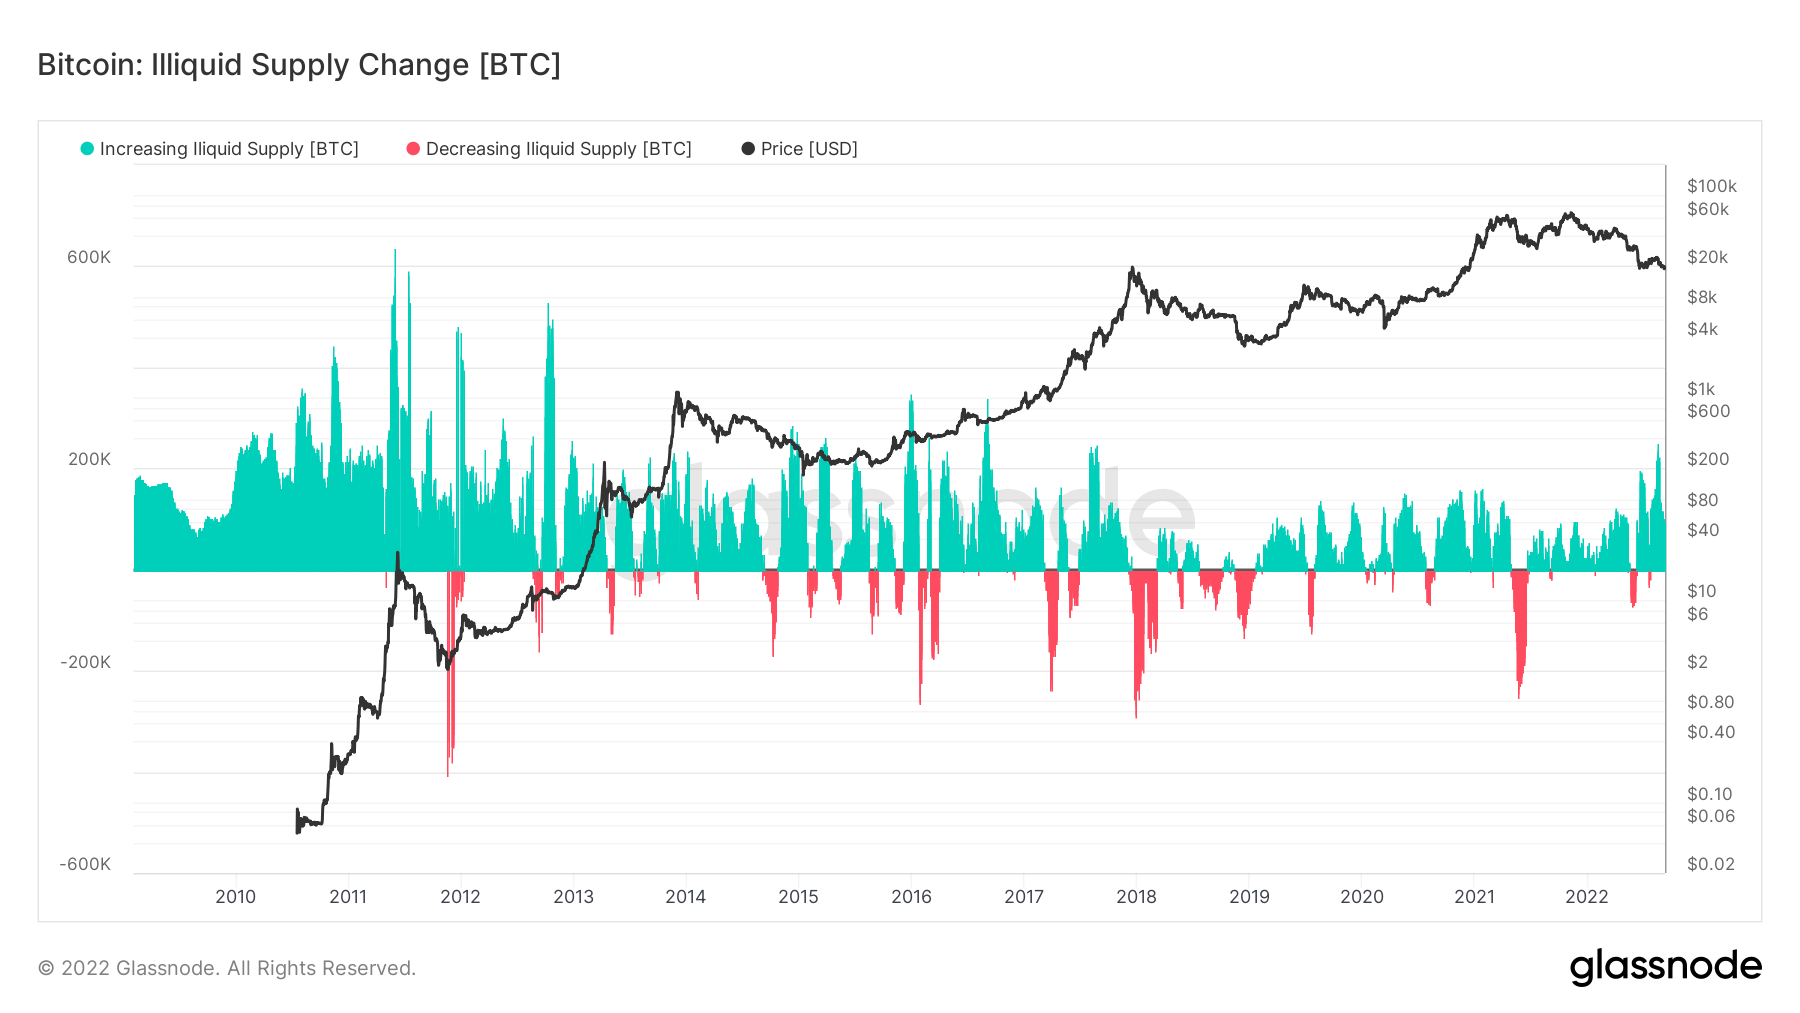
Illiquid supply continues to grow
Illiquid supply is defined as the total supply held by illiquid entities. The liquidity of an entity is defined as the ratio of cumulative outflows and cumulative inflows over the entity’s lifespan. An entity is considered to be illiquid / liquid / highly liquid if its liquidity L ass ≲ 0.25 / 0.25 ≲ L ≲ 0.75 / 0.75 ≲ L, respektiv.
Illiquid supply continues to grow through a bear market and a global deleveraging event occurring in the macro. This is an encouraging sign; even if the buyer demand is not strong, investors are not willing to let go of their BTC. Currently, 74% of the Bitcoin supply is illiquid. The illiquid supply has grown by almost 1 million BTC since the beginning of the year, currently at a staggering 14.8 million BTC.
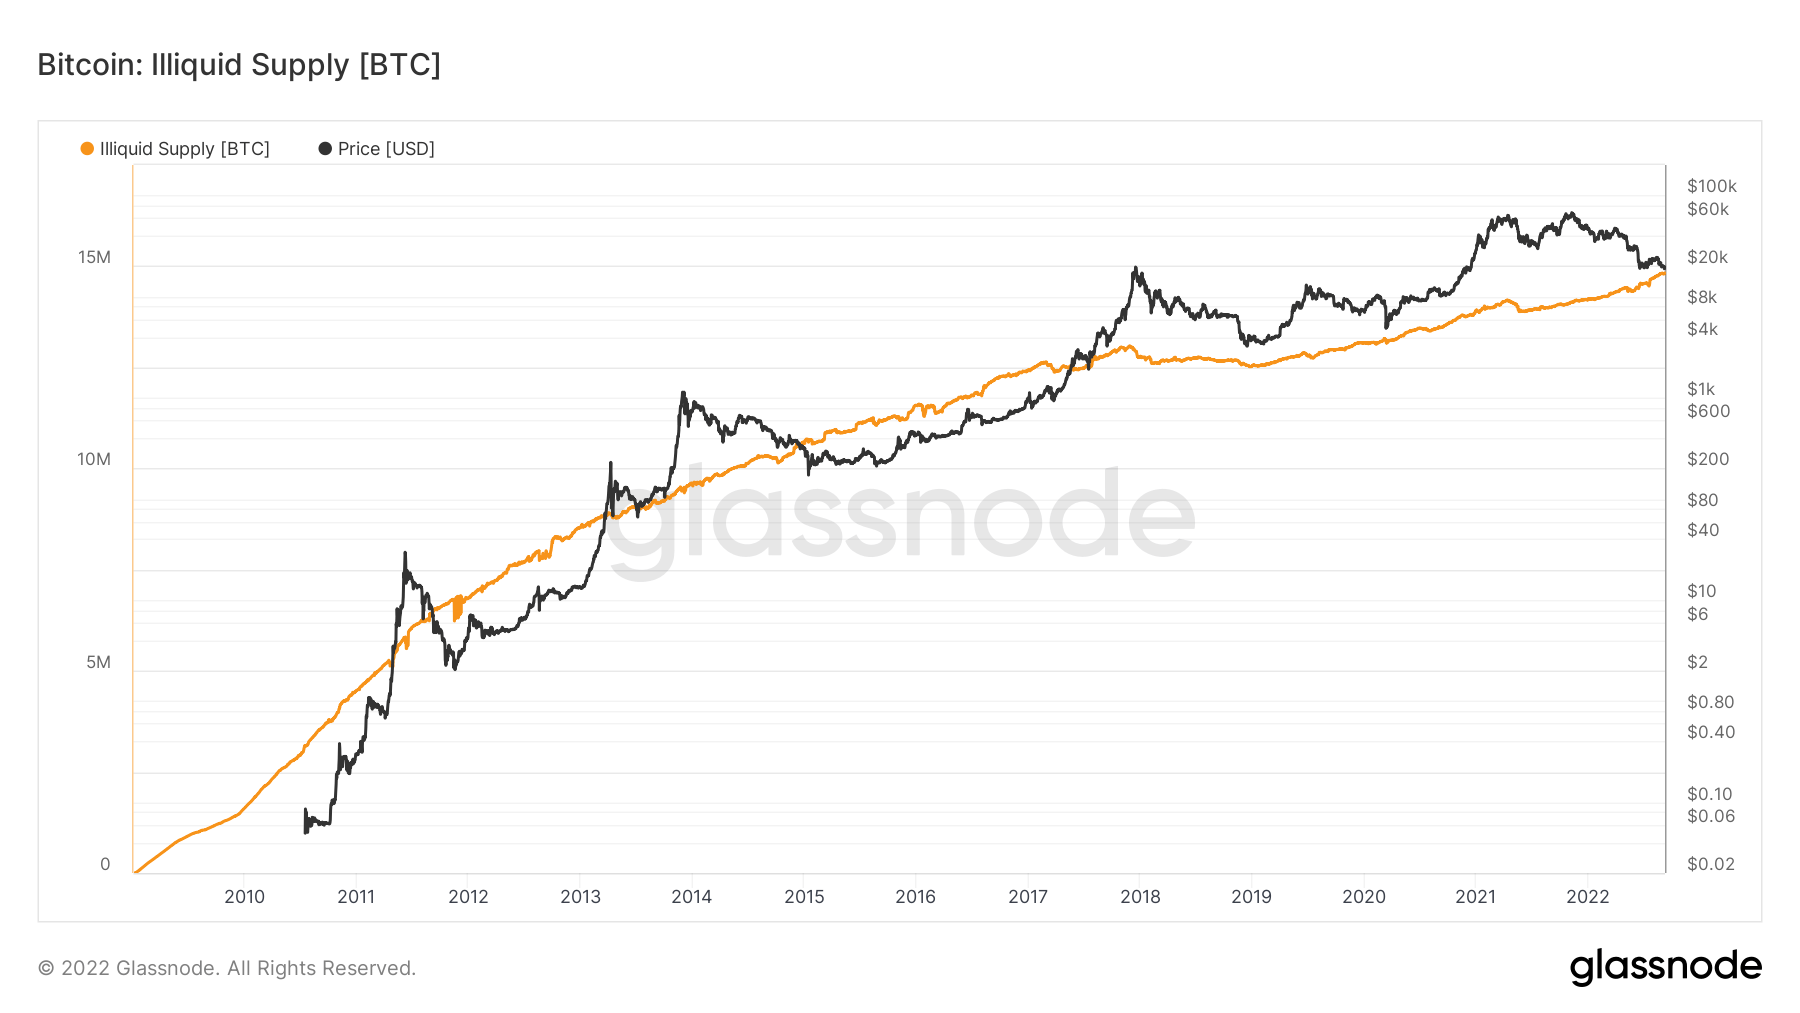
The chart below confirms our assumption that the illiquid supply of BTC is still growing. Despite the significant drop in price this year, long-term investors’ net accumulation is still positive as more Bitcoin is being put away into “cold” storage. There has been a visible surge in coins becoming more illiquid over the last few months — 400,000 BTC — as investors move to scoop up the relatively cheap BTC.
Kohorten
Brécht relativ Verhalen duerch Portemonnaie vun verschiddenen Entitéiten.
SOPR - De Spent Output Profit Ratio (SOPR) gëtt berechent andeems de realiséierte Wäert (an USD) gedeelt gëtt duerch de Wäert bei der Schafung (USD) vun engem verbrauchte Ausgab. Oder einfach: Präis verkaf / Präis bezuelt. Laangfristeg Holder SOPR 0.60 -72.48% (7 D)
Short Term Holder SOPR (STH-SOPR) ass SOPR deen nëmme verbraucht Ausgänge méi jonk wéi 155 Deeg berücksichtegt an als Indikator déngt fir d'Behuele vu kuerzfristeg Investisseuren ze bewäerten. Kuerzfristeg Holder SOPR 0.99 0.00% (7 D)
D'Akkumulation Trend Score ass en Indikator, deen d'relativ Gréisst vun Entitéiten reflektéiert, déi aktiv Mënzen op der Kette sammelen wat hir BTC Holdings ugeet. D'Skala vum Akkumulatiounstrend Score representéiert souwuel d'Gréisst vum Entitéite Gläichgewiicht (hir Participatioun Score), wéi och d'Quantitéit vun neie Mënzen déi se am leschte Mount kaaft/verkaaft hunn (hire Gläichgewiicht änneren Score). En Akkumulationstrend Score vu méi no bei 1 weist datt op aggregéiert méi grouss Entitéiten (oder e groussen Deel vum Netz) accumuléieren, an e Wäert méi no bei 0 weist datt se verdeelen oder net accumuléieren. Dëst gëtt Abléck an d'Gläichgewiicht Gréisst vun de Maart Participanten, an hirem Akkumulation Verhalen iwwer de leschte Mount. Akkumulation Trend Score 0.173 1630.00% (7 D)
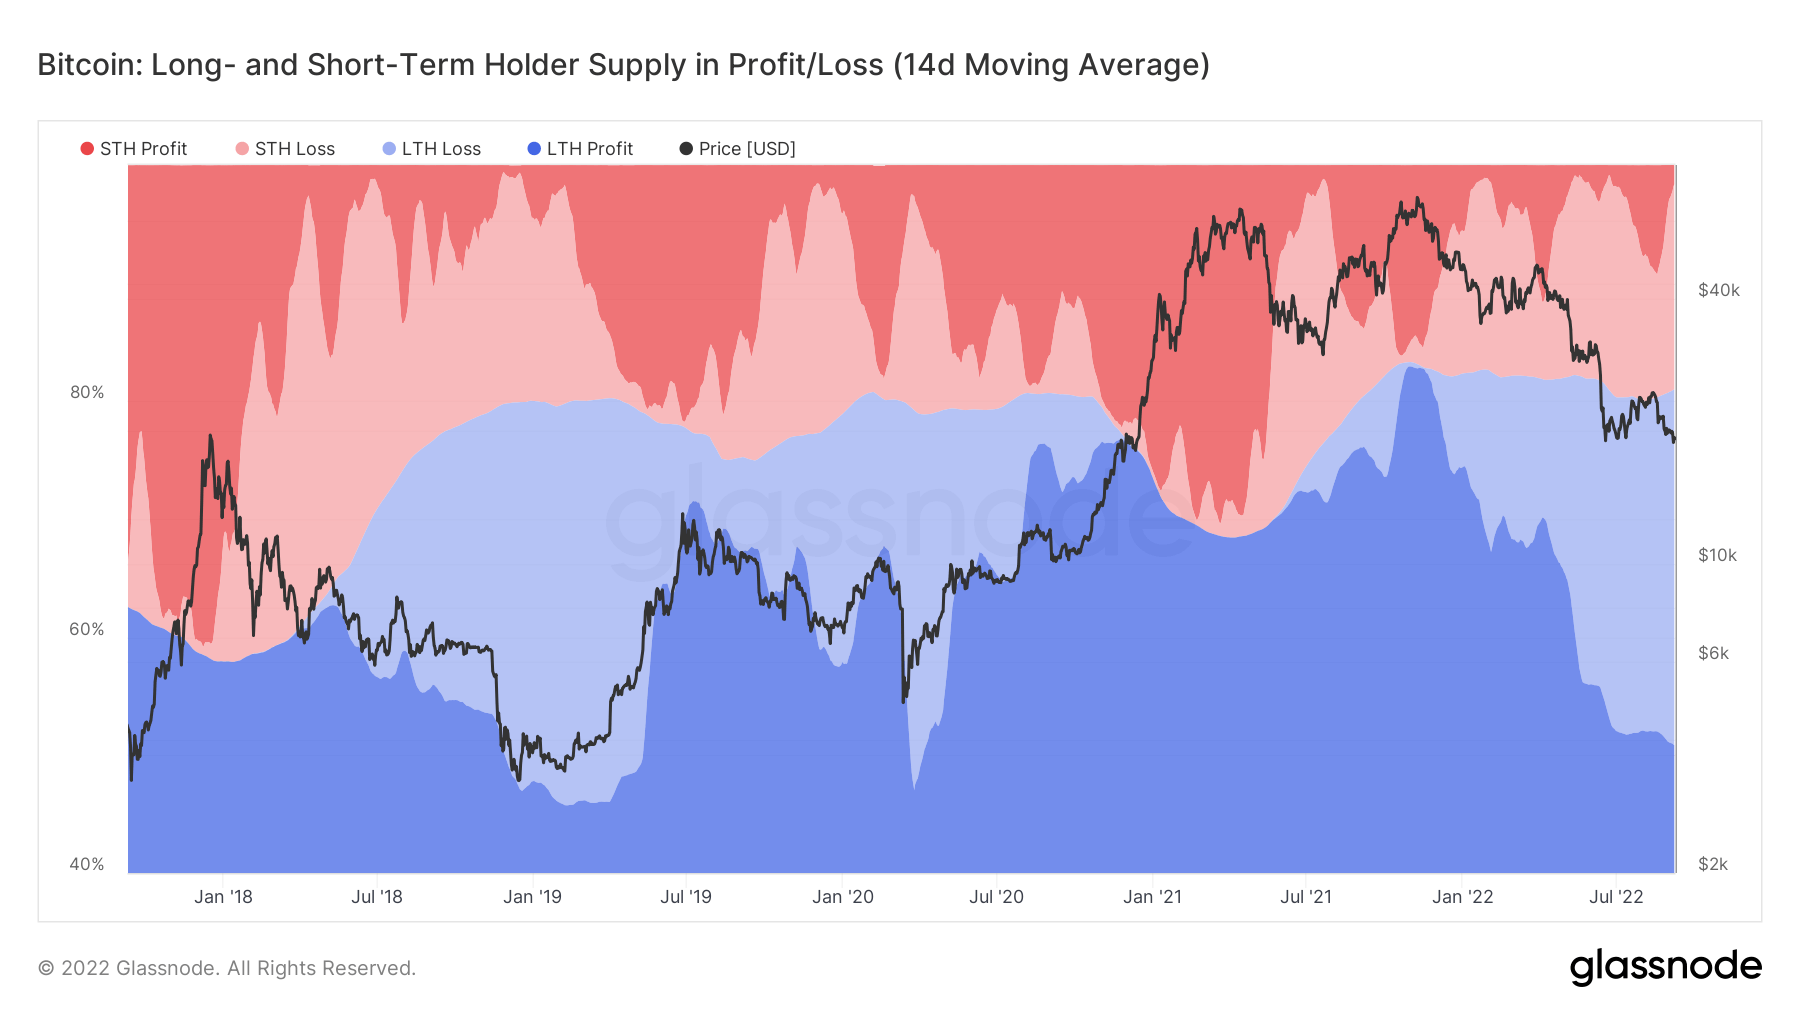
Long-term holders underwater
Long-term holders are defined as investors who have held bitcoin for more than 155 days. LTHs (blue shading) currently hold 80% of the supply of BTC, which is similar to previous bear market lows such as 2019 and 2020, as STHs capitulate due to price correction.
Currently, over 30% of LTHs are at a loss with their BTC purchases which is the most since 2020, and with a high degree of certainty, they bought during the peak of the 2021 bull run. However, this new cohort that came in during the 2021 bull run is not selling at these price levels, which only strengthens the network for the long term.
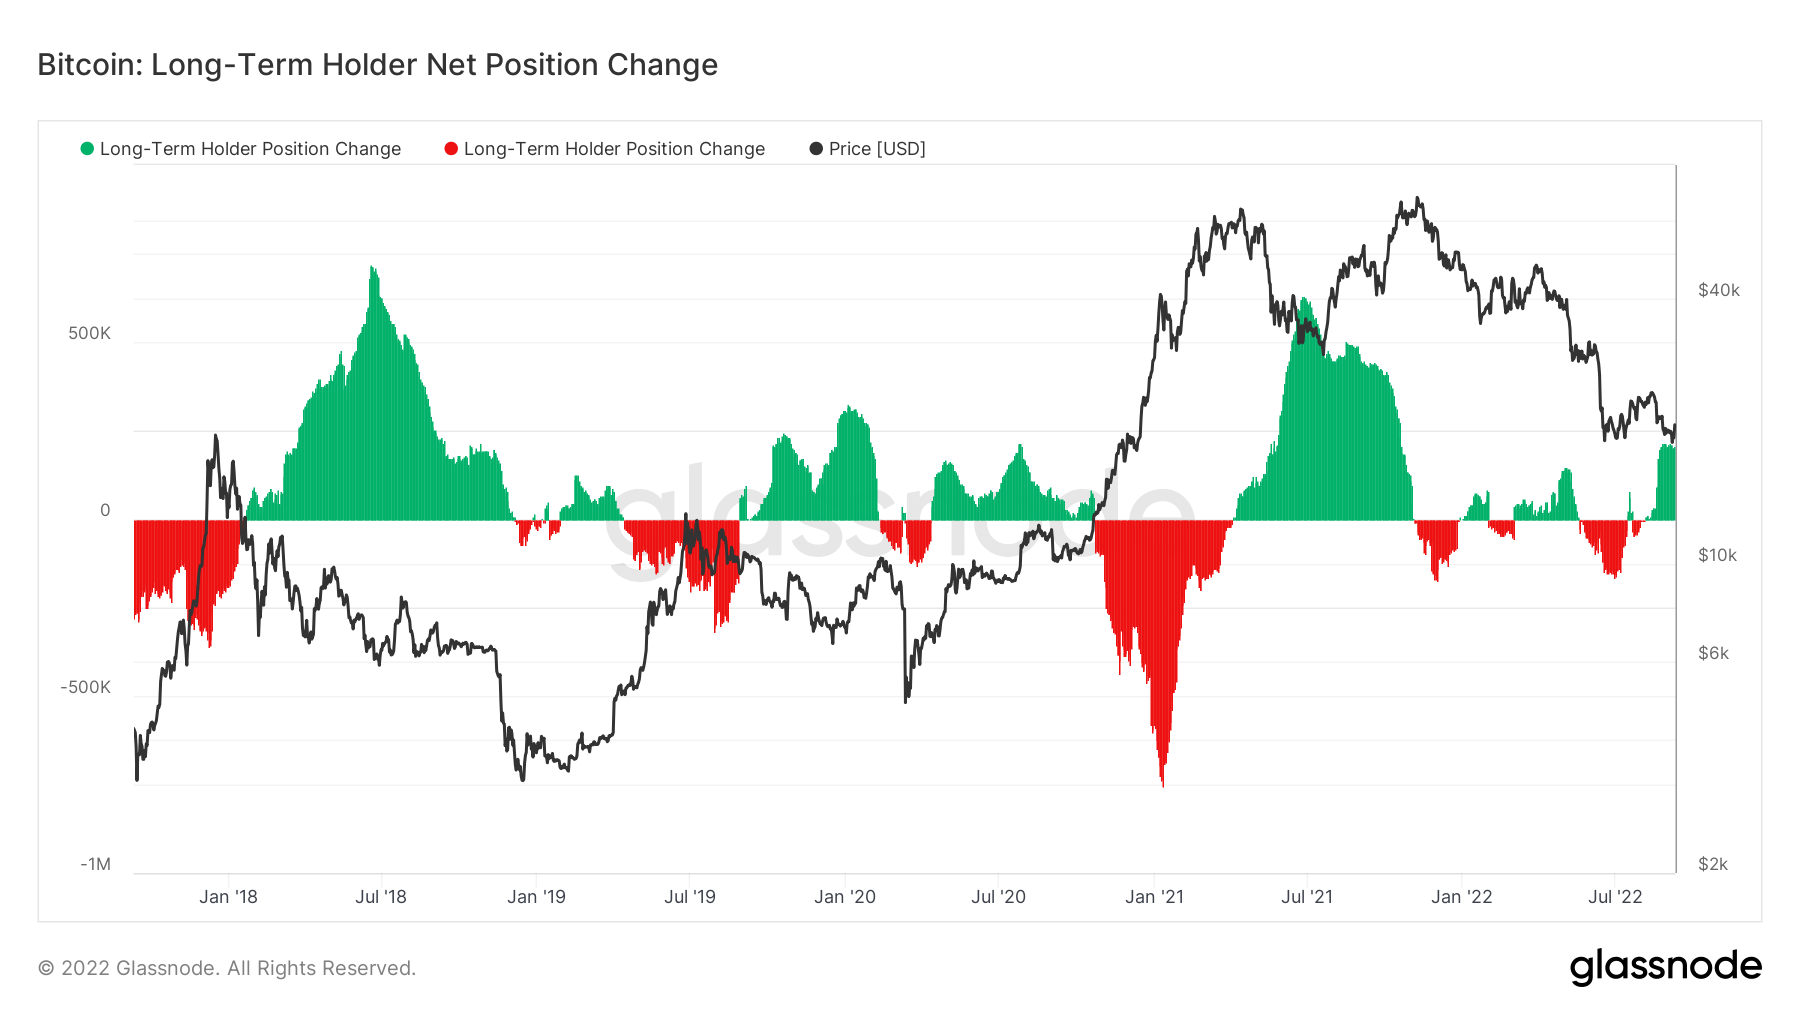
Laangfristeg Inhaber accumuléieren weider
LTHs are seeing these current price levels as a time for accumulation during this “crypto winter”. LTHs buy BTC when the price is suppressed, but considering the uncertainty and macro events that have taken place this year, it is encouraging to see accumulation to this degree. Due to the significance of uncertainty for LTHs, they are flipping between distribution and accumulation with considerably smaller quantities than in previous cycles.
Stablecoins
Eng Zort cryptocurrency déi vun Reserve Verméigen ënnerstëtzt gëtt an dofir Präisstabilitéit ubidden kann.
De Gesamtbetrag vun de Mënzen déi op Austauschadressen ofgehale ginn. Stablecoin Austauschbalance $ 37.43B 1.61% (7 D)
De Gesamtbetrag vun USDC ofgehalen op Austauschadressen. USDC Exchange Balance $ 2.46B -12.75% (7 D)
De Gesamtbetrag vun USDT ofgehalen op Austauschadressen. USDT Exchange Balance $ 17.01B 1.61% (7 D)
‘Dry powder’
“Dry Powder” refers to the number of stablecoins available on exchanges held by investors who have acquired tokens such as USDC or USDT. The general assumption is high levels of stablecoins held on exchanges are a bullish sign for BTC as it shows a willingness to keep capital in the crypto markets until conditions change.
The chart below shows around $40 billion stablecoins waiting to be deployed, which is almost at an all-time high as participants are waiting for the macro to change from risk off to risk on.
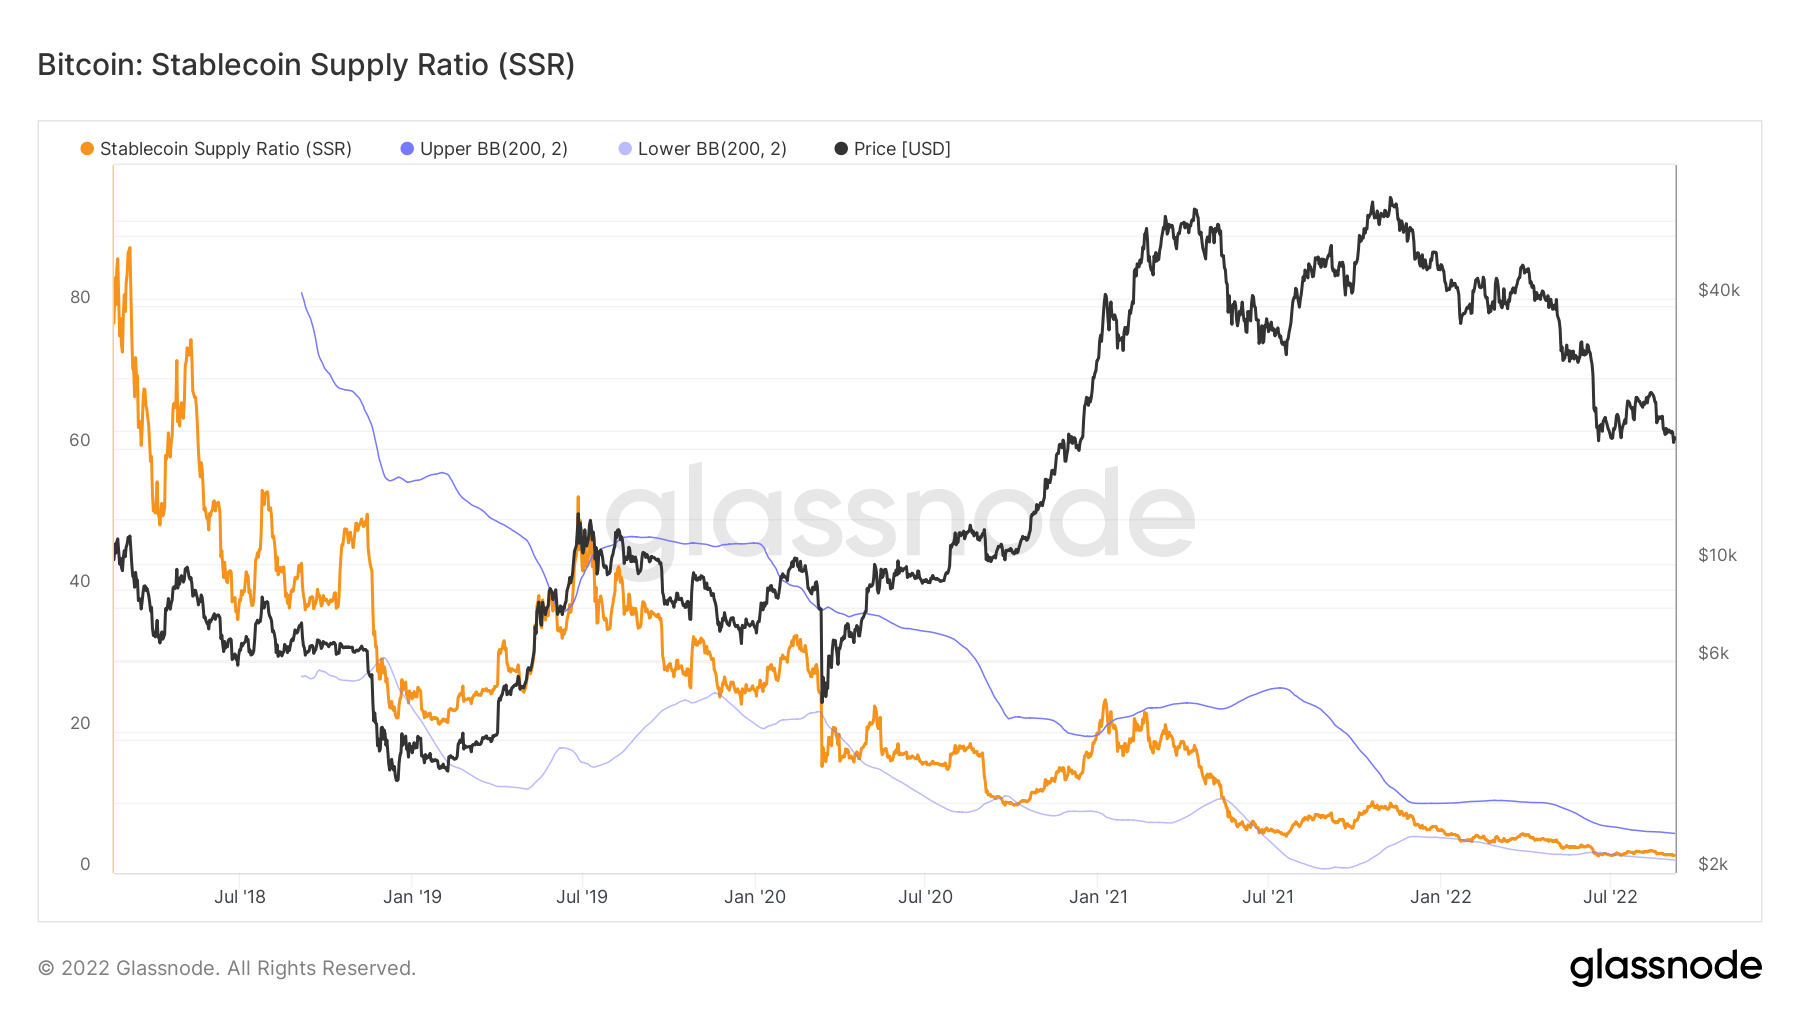
(*The chart above only accounts for the following Stablecoins: BUSD, GUSD, HSUD, DAI, USDP, EURS, SAI, USDD, USDT, USDC)
Source: https://cryptoslate.com/market-reports/weekly-macroslate-bitcoin-facing-first-global-recession-as-currency-collapses-energy-crisis-becomes-reality-for-europe/