
Markets are still riding on the slight bull activity, with the global market cap sitting 0.31% above its previous 24-hour mark as the total cap stands at $1.04T as of press time. The fear and greed index is still am 42.
Bitcoin (BTC) Analyse
Bitcoin (BTC) price has encountered minor bear activity, trading at $25.6K after recording a daily decrease of 0.4%, as the weekly drop now stands at 5.5%. Bitcoin’s trade volume dropped by 3.2% during the same period and is presently at $12B.
The Bollinger bands maintain a close distance, showing low volatility levels. The Relative Strength Index (RSI) is still above its average as bulls and bears fight for dominance. The MACD also moves in the green zone close to the neutral line.


Perpetual Protocol (PERP) analysis
PERP is facing massive bull activity, trading at $0.7679 after recording a daily increase of 7.4%, as the weekly rise now stands at 78%. PERP’s trade volume has also jumped by 68% during the same period and is presently at $151M.
The Bollinger bands are now diverging, showing increasing volatility levels. The Relative Strength Index (RSI) is still above its average in the overbought region as bulls dominate. The MACD also moves in the green zone.

DODO (DODO) Analysis
DODO is also facing bear activity, trading at $0.1092 after recording a daily decrease of 1.32% after a short-day rally, as the weekly rise now stands at 7.8%. DODO’s trade volume jumped by 45% during the same period and is presently at $57.4M.
The Bollinger bands are now moving close to each other, showing low volatility levels. The Relative Strength Index (RSI) is above its average as bulls dominate. The MACD also moves in the green zone.

Synthetix (SNX) analysis
SNX is also facing bull activity, trading at $2.3434 after recording a daily increase of 3.2%, as the weekly rise now stands at 26%. SNX’s trade volume jumped by 161% during the same period and is presently at $134M.
The Bollinger bands are now diverging, showing increasing volatility levels. The Relative Strength Index (RSI) is still above its average, close to the overbought region, as bulls dominate. The MACD also moves in the green zone.

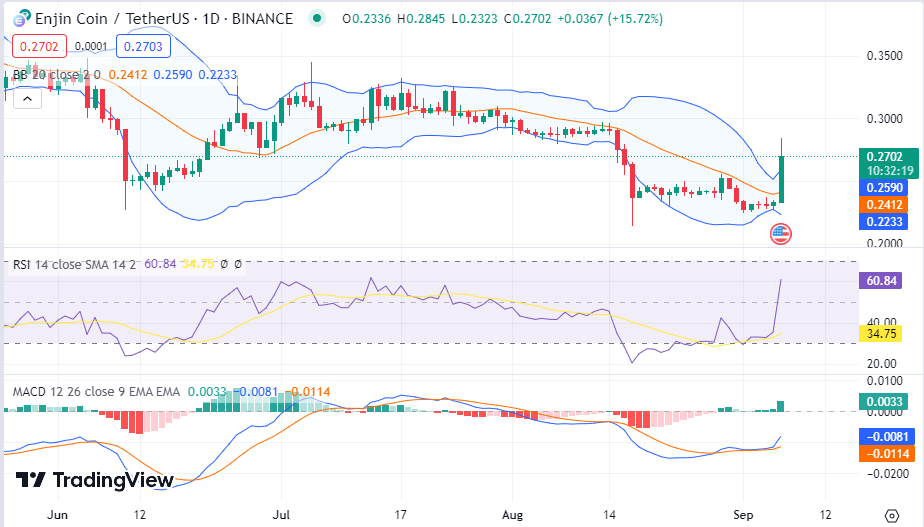
Enjin Coin (ENJ) Analysis
ENJ is also having a bull run, trading at $0.2654 after recording a daily increase of 14%, as the weekly rise now stands at 7.7%. ENJ’s trade volume jumped by 1451% during the same period and is presently at $133M.
The Bollinger bands are now diverging, showing increasing volatility levels as the Relative Strength Index (RSI) moves above its average close to the overbought region as bulls dominate. The MACD also moves in the green zone.
Source: https://blockchainreporter.net/market-analysis-btc-perp-dodo-snx-enj/